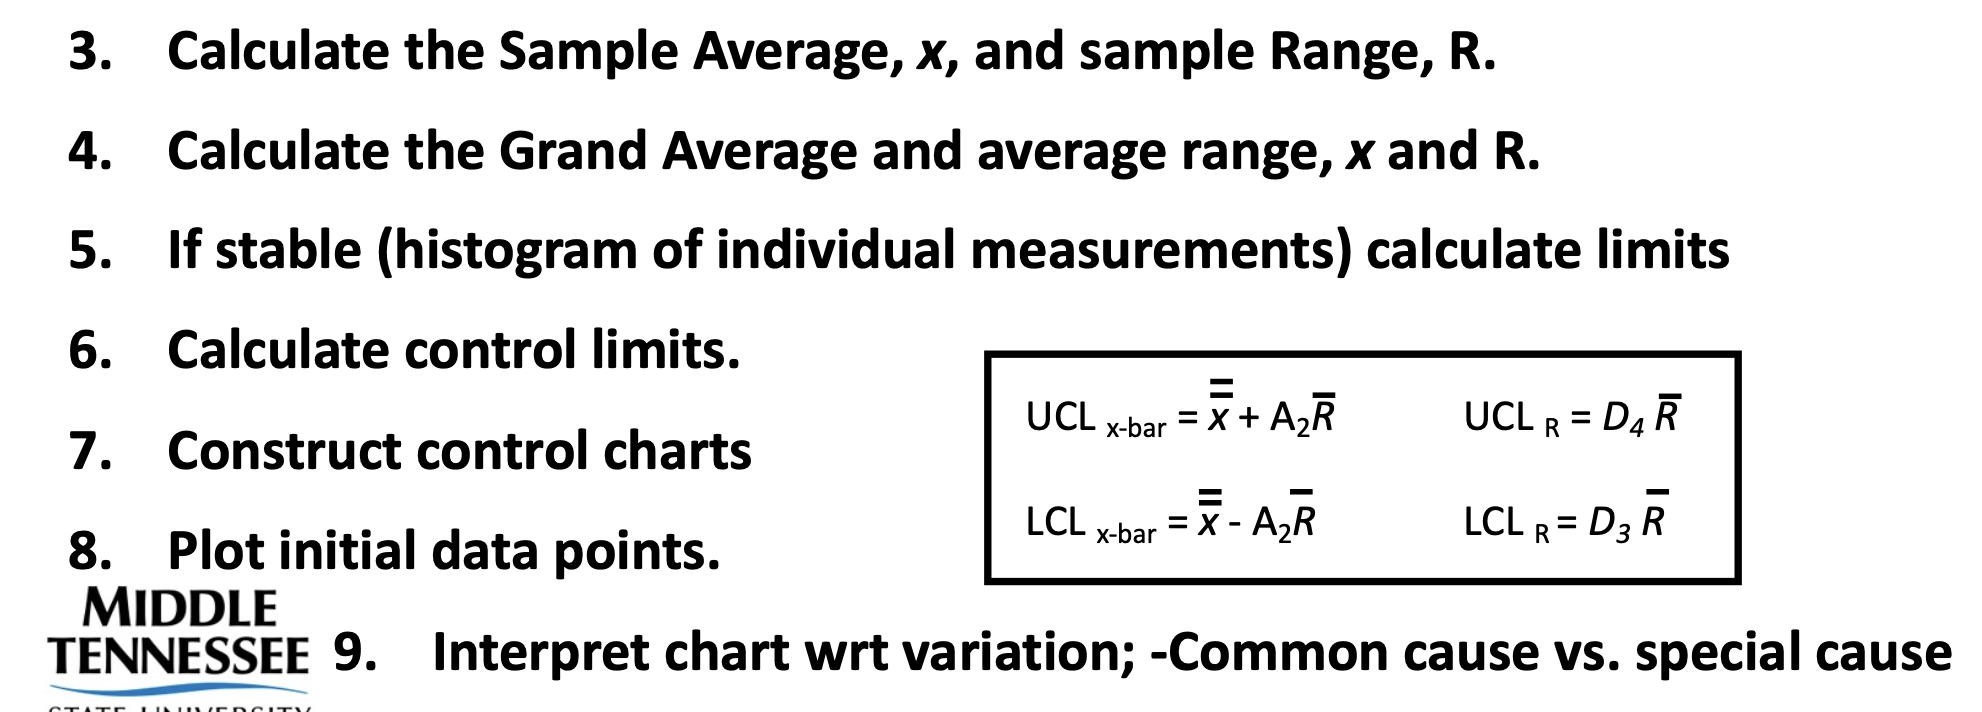
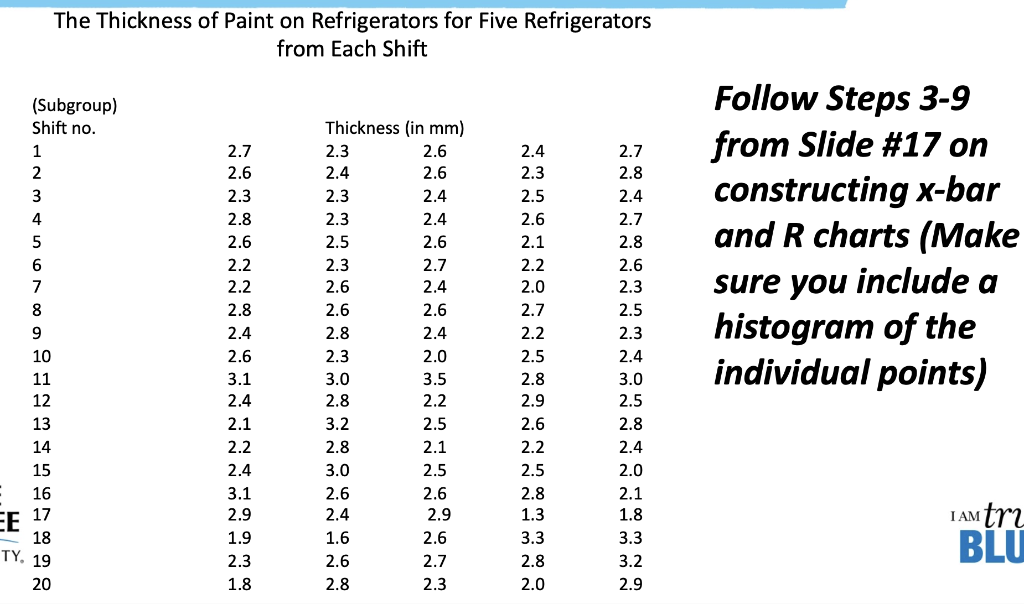
Question: 3. Calculate the Sample Average, x, and sample Range, R. 4. Calculate the Grand Average and average range, x and R. UCL x-bar 5. If

3. Calculate the Sample Average, x, and sample3. Calculate the Sample Average, x, and sample

3. Calculate the Sample Average, x, and sample Range, R. 4. Calculate the Grand Average and average range, x and R. UCL x-bar 5. If stable (histogram of individual measurements) calculate limits 6. Calculate control limits. x UCL r = DAR 7. Construct control charts EX-A 8. Plot initial data points. LCL R= D3 R MIDDLE TENNESSEE 9. Interpret chart wrt variation; -Common cause vs. special cause LCL x-bar TAT The Thickness of Paint on Refrigerators for Five Refrigerators from Each Shift (Subgroup) Shift no. 1 2 3 4 5 6 7 8 9 2.7 2.6 2.3 2.8 2.6 2.2 2.2 2.8 2.4 2.6 3.1 2.4 2.1 2.2 2.4 3.1 2.9 1.9 2.3 1.8 10 11 12 13 14 15 16 17 18 Thickness (in mm) 2.3 2.6 2.4 2.6 2.3 2.4 2.3 2.4 2.5 2.6 2.3 2.7 2.6 2.4 2.6 2.6 2.8 2.4 2.3 2.0 3.0 3.5 2.8 2.2 3.2 2.5 2.8 2.1 3.0 2.5 2.6 2.6 2.4 2.9 1.6 2.6 2.6 2.7 2.8 2.3 Follow Steps 3-9 from Slide #17 on constructing x-bar and R charts (Make sure you include a histogram of the individual points) 2.4 2.3 2.5 2.6 2.1 2.2 2.0 2.7 2.2 2.5 2.8 2.9 2.6 2.2 2.5 2.8 1.3 3.3 2.8 2.0 2.7 2.8 2.4 2.7 2.8 2.6 2.3 2.5 2.3 2.4 3.0 2.5 2.8 2.4 2.0 2.1 1.8 3.3 3.2 2.9 EE I Am tr2 BLU TY, 19 20

Step by Step Solution

There are 3 Steps involved in it

1 Expert Approved Answer
Step: 1 Unlock blur-text-image
Question Has Been Solved by an Expert!

Get step-by-step solutions from verified subject matter experts

Step: 2 Unlock
Step: 3 Unlock

Students Have Also Explored These Related General Management Questions!