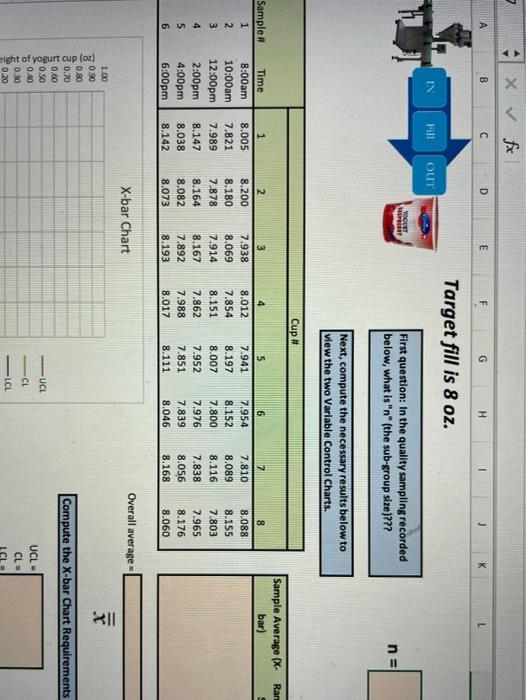
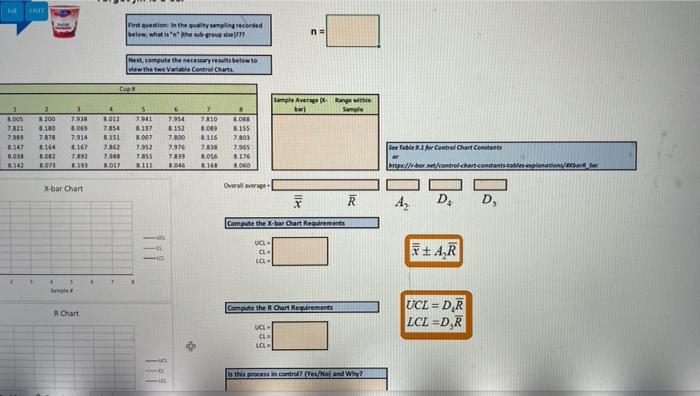
Question: x B D E G H K Target fill is 8 oz. IN Fill OUT TOGUET UDGET First question: In the quality sampling recorded below,

x B D E G H K Target fill is 8 oz. IN Fill OUT
x B D E G H K Target fill is 8 oz. IN Fill OUT TOGUET UDGET First question: In the quality sampling recorded below, what is "n" (the sub-group size)??? n = Next, compute the necessary results below to view the two Variable Control Charts. Cup # Raru Sample Average (X- bar) Sample # Time 1 2 3 4 S 6 7 8 1 8:00am 8.005 8.200 7.938 8.012 7.941 7.810 8.088 7.954 8.152 2 10:00am 7.821 8.180 8.069 7.854 8.151 8.197 8.007 8.089 8.116 8.155 7.803 3 7.989 7.878 7.914 7.800 4 8.147 8.164 8.167 7.862 7.952 7.976 7.838 12:00pm 2:00pm 4:00pm 6:00pm 7.965 8.176 5 8.038 8.082 7.892 7.988 7.851 7.839 8.056 6 8.142 8.073 8.193 8.017 8.111 8.046 8.168 8.060 X-bar Chart Overall average- 1.00 0.90 0.80 0.70 Compute the X-bar Chart Requirements 0.60 Right of yogurt cup (oz) 0.50 UCL 0.40 UCL CL 0.30 CLE 0.20 -LCL I in question in the quality recorded below, what wou? n= Next compute the necessary results below to view the two variable Control Chart Sample Average Range with Sample 1 1 4 6 > 5 7.11 BOS 3.200 7.93 2012 7.954 7810 RO 7.521 8180 8.059 7.54 5.197 3.089 IS 7.989 7.878 7.914 5.151 8.007 7.300 8.116 7.803 3.347 167 7.862 7.952 7976 7.833 7965 See Table 9.1 for Control Chart Contents 30 8144 8082 KOT 7.892 7.868 7.853 7.839 8.056 3176 1142 2017 8168 1060 Artesbret/control chart contents tables onani Overaller X-bar Chart F R 12 D. D Compute the X-bar Chart Requirements UCL CLE LCL FUAR Compute the R. Chart Requirements R Chart UCL = D.R LCL =D,R UCE LCL this process in control? Yes/Nel and Why? 6 6:00pm 8.142 8.073 8.193 8.017 8.111 8.046 8.168 8.060 X-bar Chart Overall average = 1 1.00 2 0.90 3 0.80 4 0.70 Compute the X-bar 0.60 5 Weight of yogurt cup (oz) 0.50 UCI 6 0.40 UCL -CL 7 0.30 CL = 8 0.20 LCL LC 0.10 9 0.00 0 1 N 3 4 5 6 7 8 1 Sample # 2 3 Compute the R Cha R Chart 4 5 1.00 UCL = -6 0.80 CL LC = 18 0.70 0.60 8 0.50 50.40 0.30 UCL 59 Range of Weight of yogurt cup (oz) CL 30 Is this process in ce 0.20 LCL 0.10 31 0.00 42 1 2 4 5 6 7 8 43 Sample # Should I keep mak 2.800 8.116 7.803 7.976 7.838 8.056 See Table 9.1 for Control Chart Constants 7.839 7.965 8.176 8.060 or 8.046 8.168 https://r-bar.net/control-chart-constants-tables explanations/Xbor Sec Overall average . R D3 A2 D4 Compute the X-bar Chart Requirements UCL = CL LCL + AR Compute the R Chart Requirements UCL = D.R LCL =D,R UCL CL LCL Is this process in control? (Yes/No) and Why? Should I keep making yogurt? Compute the X-bar Chart Requirements UCL = CL = LCL = ++ AR Compute the R Chart Requirements UCL = D.R LCL =D,R UCL = CL = LCL = Is this process in control? (Yes/No) and Why? Should I keep making yogurt

Step by Step Solution

There are 3 Steps involved in it

1 Expert Approved Answer
Step: 1 Unlock blur-text-image
Question Has Been Solved by an Expert!

Get step-by-step solutions from verified subject matter experts

Step: 2 Unlock
Step: 3 Unlock

Students Have Also Explored These Related General Management Questions!