

Question: 3. Consider the two graphs below. Graph A represents a typical firm in a purely competitive industry. Graph B represents the supply and demand conditions

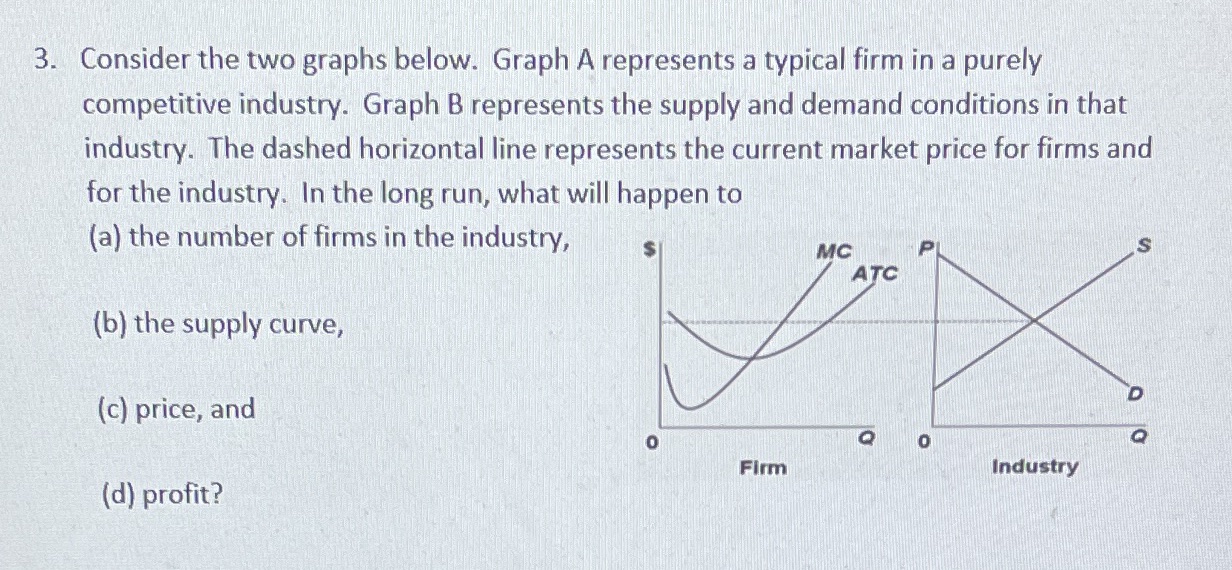
3. Consider the two graphs below. Graph A represents a typical firm in a purely competitive industry. Graph B represents the supply and demand conditions in that industry. The dashed horizontal line represents the current market price for firms and for the industry. In the long run, what will happen to (a) the number of firms in the industry, MC P ATC (b) the supply curve, D (c) price, and 0 O Firm Industry (d) profit
Step by Step Solution
There are 3 Steps involved in it
1 Expert Approved Answer
Step: 1 Unlock

Question Has Been Solved by an Expert!
Get step-by-step solutions from verified subject matter experts
Step: 2 Unlock
Step: 3 Unlock