

Question: Answer for 2-A only Question 2 Consider the two graphs below. Graph A represents a typical rm in a purely competitive industry. Graph B represents
Answer for 2-A only
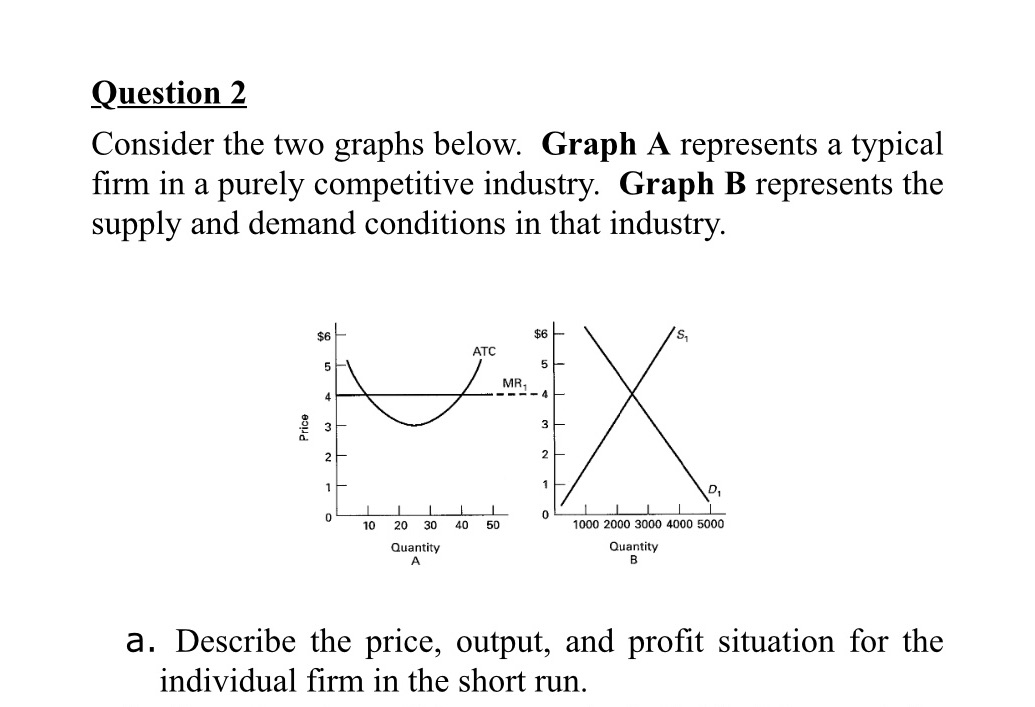
Question 2 Consider the two graphs below. Graph A represents a typical rm in a purely competitive industry. Graph B represents the supply and demand conditions in that industry. $6 as s. RTE 5 5 M R1 4 _ _ . a 3 3 a. 2 2 1 1 0' 0 0 10 20' 30 40 ED 1000 2000 3000 4000 5000 Quantity Quantity A B a. Describe the price, output, and prot situation for the individual rm in the short run
Step by Step Solution
There are 3 Steps involved in it
1 Expert Approved Answer
Step: 1 Unlock

Question Has Been Solved by an Expert!
Get step-by-step solutions from verified subject matter experts
Step: 2 Unlock
Step: 3 Unlock