

Question: 3. Fill in the following payoff table (as a function of the stock price in 1 year) of a portfolio that is (i) long one
3. Fill in the following payoff table (as a function of the stock price in 1 year) of a portfolio that is (i) long one share of stock, (ii) long one 1-year put with an exercise price of $50, (iii) short one 1-year call with an exercise price of $60, (iv) short one 1-year call with an exercise price of $80, and (v) short a 1-year zero-coupon bond with a face amount of $40. Graph the payoff as a function of the stock price in 1 year. (Note: Payoff not profit, ignore the cost of these securities.)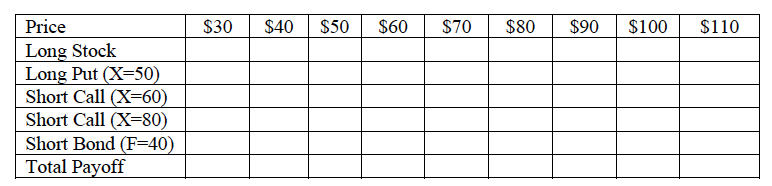
$30 $40 $50 $60 $70 $80 $90 $100 $110 Price Long Stock Long Put (X=50) Short Call (X=60) Short Call (X=80) Short Bond (F=40) Total Payoff
Step by Step Solution
There are 3 Steps involved in it

Get step-by-step solutions from verified subject matter experts