

Question: 3. Find the following values using your data from chart 1 on the first project. Chart 4 Lowest value First Quartile (Q1) Median (Q2) Third
3. Find the following values using your data from chart 1 on the first project.
Chart 4
Lowest value | |
First Quartile (Q1) | |
Median (Q2) | |
Third Quartile (Q3) | |
Highest value | |
Interquartile range |
Total Births | 4 | 3 | 3 | 2 | 7 | 3 | 3 | 4 | 3 | 5 |
4. Create a box and whisker plot using the answers from question 3. Be sure to include the number line and label it.
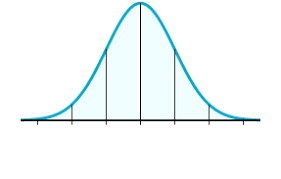
5. Label Graph 1. Using the mean and standard deviation from Chart 3, label the mean. Then label up to 3 standard deviations above and below the mean.

Step by Step Solution
There are 3 Steps involved in it
1 Expert Approved Answer
Step: 1 Unlock

Question Has Been Solved by an Expert!
Get step-by-step solutions from verified subject matter experts
Step: 2 Unlock
Step: 3 Unlock