

Question: 3. Given: Measured compressive strength of concrete as a function of curing time Curing time (days) Compressive strength of concrete (MPa) 0.1 2 17
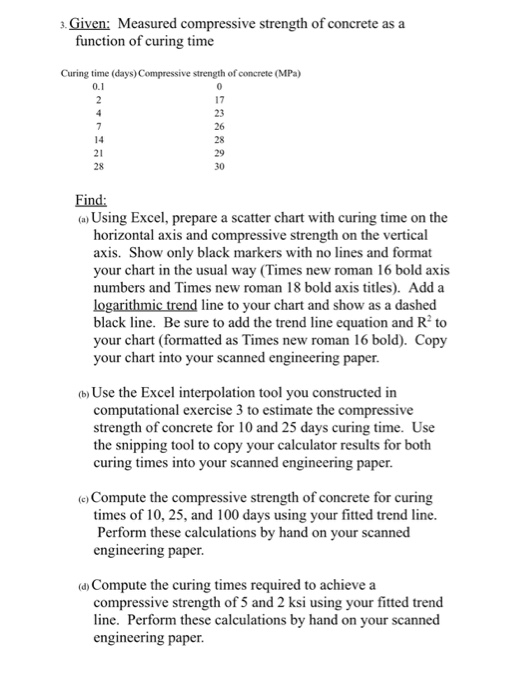
3. Given: Measured compressive strength of concrete as a function of curing time Curing time (days) Compressive strength of concrete (MPa) 0.1 2 17 4 23 7 26 14 28 21 28 29 30 Find: (a) Using Excel, prepare a scatter chart with curing time on the horizontal axis and compressive strength on the vertical axis. Show only black markers with no lines and format your chart in the usual way (Times new roman 16 bold axis numbers and Times new roman 18 bold axis titles). Add a logarithmic trend line to your chart and show as a dashed black line. Be sure to add the trend line equation and R to your chart (formatted as Times new roman 16 bold). Copy your chart into your scanned engineering paper. (b) Use the Excel interpolation tool you constructed in computational exercise 3 to estimate the compressive strength of concrete for 10 and 25 days curing time. Use the snipping tool to copy your calculator results for both curing times into your scanned engineering paper. (c) Compute the compressive strength of concrete for curing times of 10, 25, and 100 days using your fitted trend line. Perform these calculations by hand on your scanned engineering paper. (d) Compute the curing times required to achieve a compressive strength of 5 and 2 ksi using your fitted trend line. Perform these calculations by hand on your scanned engineering paper.
Step by Step Solution
There are 3 Steps involved in it
Heres how you can approach the given tasks using Excel and manual calculations a Using Excel prepare a scatter chart with curing time on the horizonta... View full answer

Get step-by-step solutions from verified subject matter experts
Document Format (2 attachments)
663e9fa774f3b_953889.pdf
180 KBs PDF File
663e9fa774f3b_953889.docx
120 KBs Word File