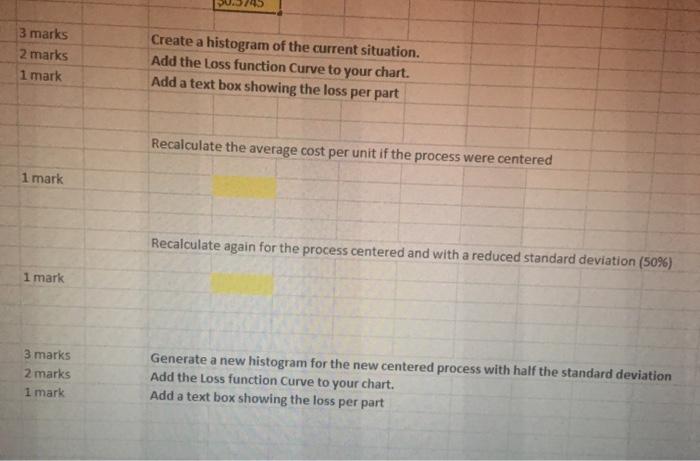
Question: 3 marks 2 marks 1 mark Create a histogram of the current situation. Add the Loss function Curve to your chart. Add a text box

3 marks 2 marks 1 mark Create a histogram of the
3 marks 2 marks 1 mark Create a histogram of the current situation. Add the Loss function Curve to your chart. Add a text box showing the loss per part Recalculate the average cost per unit if the process were centered 1 mark Recalculate again for the process centered and with a reduced standard deviation (50%) 1 mark 3 marks 2 marks 1 mark Generate a new histogram for the new centered process with half the standard deviation Add the loss function Curve to your chart. Add a text box showing the loss per part 3 marks 2 marks 1 mark Create a histogram of the current situation. Add the Loss function Curve to your chart. Add a text box showing the loss per part Recalculate the average cost per unit if the process were centered 1 mark Recalculate again for the process centered and with a reduced standard deviation (50%) 1 mark 3 marks 2 marks 1 mark Generate a new histogram for the new centered process with half the standard deviation Add the loss function Curve to your chart. Add a text box showing the loss per part

Step by Step Solution

There are 3 Steps involved in it

1 Expert Approved Answer
Step: 1 Unlock blur-text-image
Question Has Been Solved by an Expert!

Get step-by-step solutions from verified subject matter experts

Step: 2 Unlock
Step: 3 Unlock

Students Have Also Explored These Related General Management Questions!