

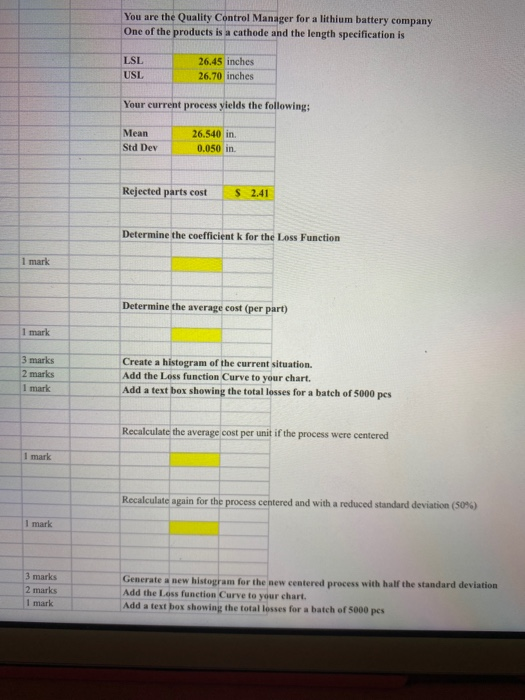
Question: can you please do it D E F G H You are the Quality Control Manager for a lithium battery company One of the products
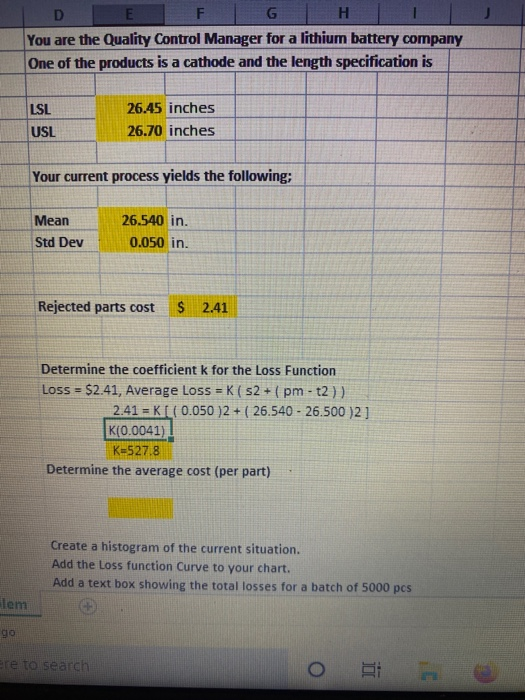
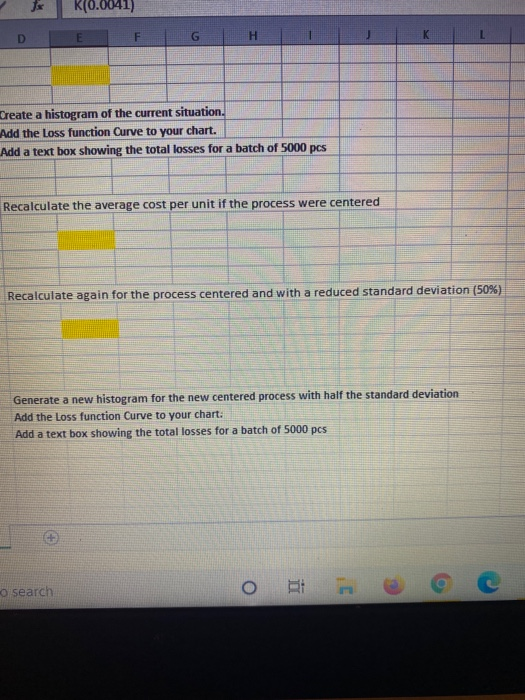
can you please do it
Step by Step Solution
There are 3 Steps involved in it
1 Expert Approved Answer
Step: 1 Unlock

Question Has Been Solved by an Expert!
Get step-by-step solutions from verified subject matter experts
Step: 2 Unlock
Step: 3 Unlock