

Question: 3. Operating break-even graph analysis When does a firm achieve it's operating break-even point? Your company is considering altering its operations going forward but is
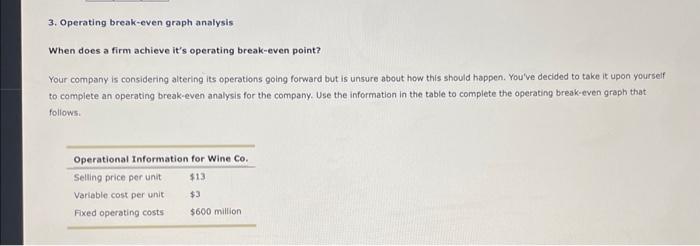
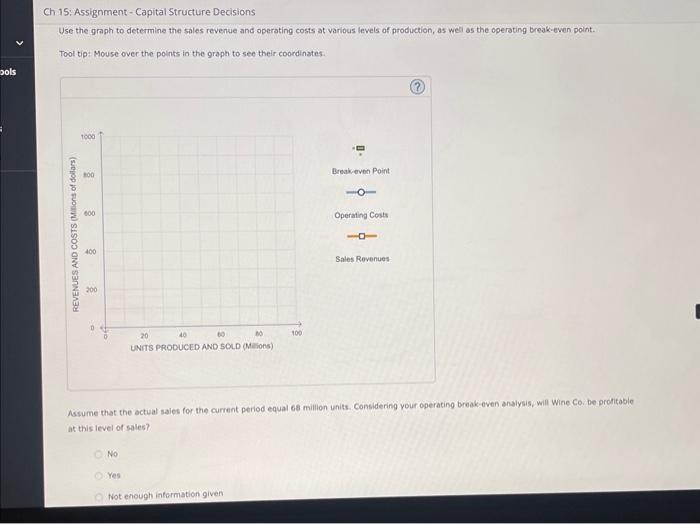
3. Operating break-even graph analysis When does a firm achieve it's operating break-even point? Your company is considering altering its operations going forward but is unsure about how this should happen. You've decided to take it upon youriself to complete an operating break-even analysis for the company. Use the information in the table to complete the operating break-even graph that follows. Use the graph to determine the sales revenue and operating costs at various levels of production, as weli as the operating break-even point. Toot tip: Mouse over the points in the graph to see their coordinates. Assume that the actual saies for the current period equal 68 million units. Considering your operating break. even onalysis, will wine Co. be profitable at this level of sales
Step by Step Solution
There are 3 Steps involved in it

Get step-by-step solutions from verified subject matter experts