

Question: (3) Prepare ratio analyses (for 2018, 2017, and 2016) for both companies. You should include the following ratios in your computations: Profitability ratios o Gross
(3) Prepare ratio analyses (for 2018, 2017, and 2016) for both companies. You should include the following ratios in your computations: Profitability ratios o Gross Profit margin o Profit margin o Return on assets o Return on equity Productivity o Inventory Turnover o days inventory outstanding o PPE Turnover o Asset Turnover Solvency o Debt-to-equity o Times interest earned o Return on Financial leverage Liquidity o Current Ratio o Quick Ratio o Working capital
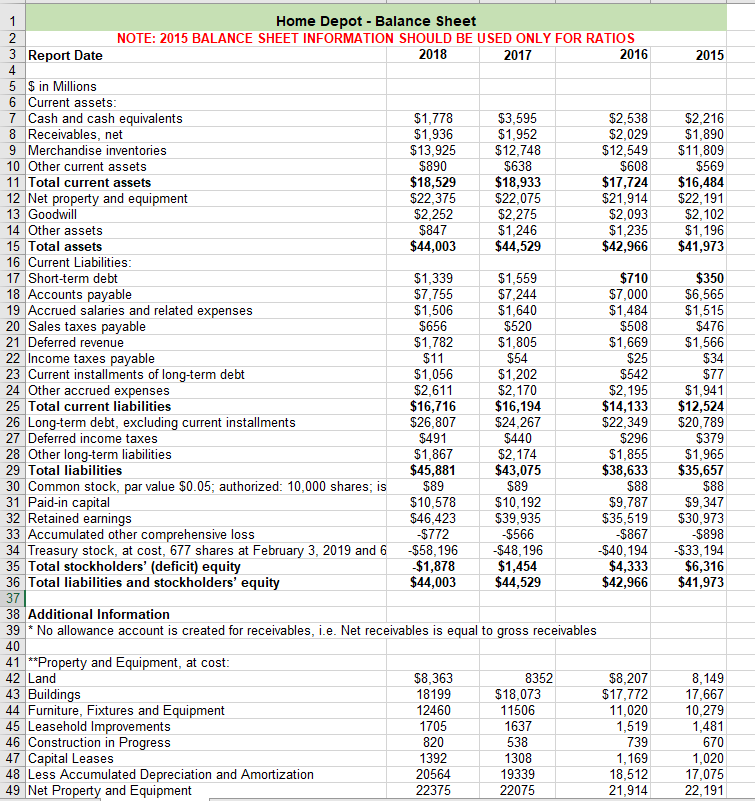
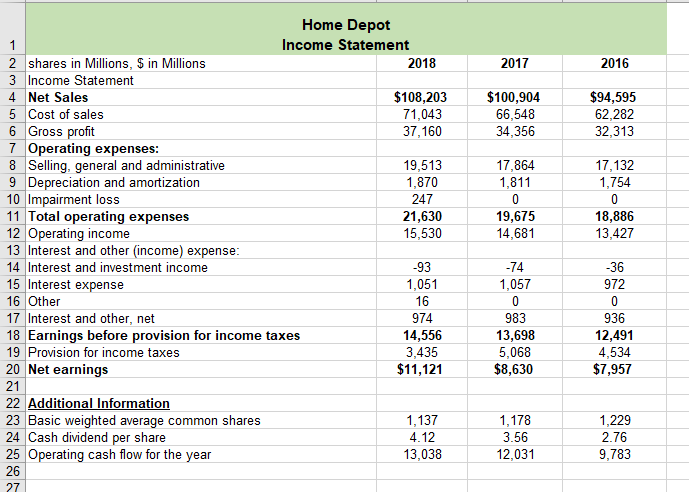
1 2015 $2,216 $1,890 $11,809 $569 $16,484 $22,191 $2,102 $1,196 $41,973 Home Depot - Balance Sheet 2 NOTE: 2015 BALANCE SHEET INFORMATION SHOULD BE USED ONLY FOR RATIOS 3 Report Date 2018 2017 2016 4 5 $ in Millions 6 Current assets: 7 Cash and cash equivalents $1,778 $3,595 $2,538 8 Receivables, net $1,936 $1,952 $2,029 9 Merchandise inventories $13,925 $12,748 $12,549 10 Other current assets $890 $638 $608 11 Total current assets $18,529 $18,933 $17,724 12 Net property and equipment $22,375 $22,075 $21,914 13 Goodwill $2,252 $2,275 $2,093 14 Other assets $847 $1,246 $1,235 15 Total assets $44,003 $44,529 $42,966 16 Current Liabilities: 17 Short-term debt $1,339 $1,559 $710 18 Accounts payable $7,755 $7,244 $7,000 19 Accrued salaries and related expenses $1,506 $1,640 $1,484 20 Sales taxes payable $656 $520 $508 21 Deferred revenue $1,782 $1,805 $1,669 22 Income taxes payable $11 $54 $25 23 Current installments of long-term debt $1,056 $1,202 $542 24 Other accrued expenses $2,611 $2,170 $2,195 25 Total current liabilities $16,716 $16,194 $14,133 26 Long-term debt, excluding current installments $26,807 $24,267 $22,349 27 Deferred income taxes $491 $440 $296 28 Other long-term liabilities $1,867 $2,174 $1,855 29 Total liabilities $45,881 $43,075 $38,633 30 Common stock, par value $0.05; authorized: 10,000 shares; is $89 $89 $88 31 Paid-in capital $10,578 $10,192 $9,787 32 Retained earnings $46,423 $39,935 $35,519 33 Accumulated other comprehensive loss -$772 $566 -$867 34 Treasury stock, at cost, 677 shares at February 3, 2019 and 6 -$58, 196 -$48, 196 -$40,194 35 Total stockholders' (deficit) equity $1,878 $1,454 $4,333 36 Total liabilities and stockholders' equity $44,003 $44,529 $42,966 37 38 Additional Information 39 * No allowance account is created for receivables, i.e. Net receivables is equal to gross receivables 40 41 **Property and Equipment, at cost: 42 Land $8,363 8352 $8,207 43 Buildings 18199 $18,073 $17,772 44 Furniture, Fixtures and Equipment 12460 11506 11,020 45 Leasehold Improvements 1705 1637 1,519 46 Construction in Progress 820 538 739 47 Capital Leases 1392 1308 1,169 48 Less Accumulated Depreciation and Amortization 20564 19339 18,512 49 Net Property and Equipment 22375 22075 21,914 $350 $6,565 $1,515 $476 $1,566 $34 $77 $1,941 $12,524 $20,789 $379 $1,965 $35,657 $88 $9,347 $30,973 $898 $33,194 $6,316 $41,973 8,149 17,667 10,279 1,481 670 1,020 17,075 22, 191 1 2017 2016 $100,904 66,548 34 356 $94,595 62,282 32,313 17,132 1,754 17,864 1,811 0 19,675 14,681 0 18,886 13,427 Home Depot Income Statement 2 shares in Millions, $ in Millions 2018 3 Income Statement 4. Net Sales $108,203 5 Cost of sales 71,043 6 Gross profit 37,160 7 Operating expenses: 8 Selling, general and administrative 19,513 9 Depreciation and amortization 1,870 10 Impairment loss 247 11 Total operating expenses 21,630 12 Operating income 15,530 13 Interest and other (income) expense: 14 Interest and investment income -93 15 Interest expense 1,051 16 Other 16 17 Interest and other, net 974 18 Earnings before provision for income taxes 14,556 19 Provision for income taxes 3,435 20 Net earnings $11,121 21 22 Additional Information 23 Basic weighted average common shares 1,137 24 Cash dividend per share 4.12 25 Operating cash flow for the year 13,038 26 27 -74 1,057 0 983 13,698 5,068 $8,630 -36 972 0 936 12,491 4,534 $7,957 1,178 3.56 12,031 1,229 2.76 9,783
Step by Step Solution
There are 3 Steps involved in it

Get step-by-step solutions from verified subject matter experts