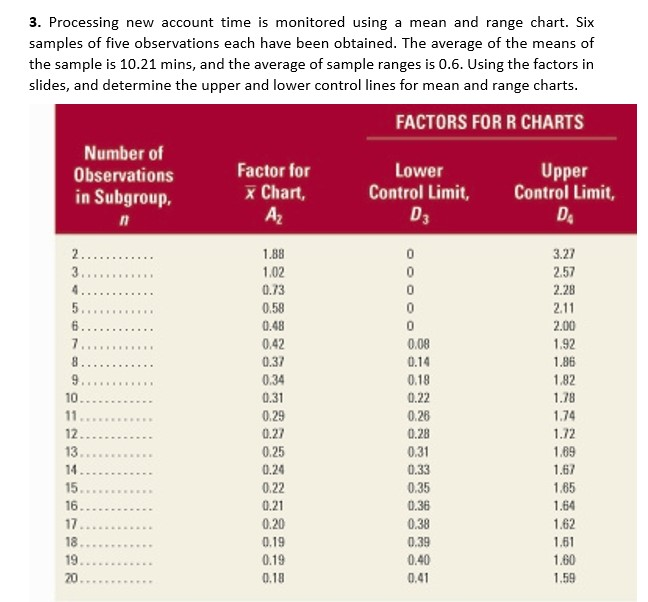
Question: 3. Processing new account time is monitored using a mean and range chart. Six samples of five observations each have been obtained. The average of

3. Processing new account time is monitored using

3. Processing new account time is monitored using a mean and range chart. Six samples of five observations each have been obtained. The average of the means of the sample is 10.21 mins, and the average of sample ranges is 0.6. Using the factors in slides, and determine the upper and lower control lines for mean and range charts. FACTORS FOR R CHARTS Number of Observations in Subgroup, n Factor for X Chart A Lower Control Limit D3 Upper Control Limit DA 2.............. 3... 4 OOOOO 5... 6 7 BER 8 10 11 12. 13 14. 15 16. 17 18 19. 20 1.88 1.02 0.73 0.58 0.48 0.42 0.37 0.34 0.31 0.29 0.27 0.25 0.24 0.22 0.21 0.20 0.19 0.19 0.18 0.08 0.14 0.18 0.22 0.26 0.28 0.31 0.33 0.35 0.36 0.38 0.39 0.40 0.41 3.27 2.57 2.28 2.11 2.00 1.92 1.86 1.82 1.78 1.74 1.72 1.89 1.67 1.65 1.64 1.62 1.61 1.60 1.59

Step by Step Solution

There are 3 Steps involved in it

1 Expert Approved Answer
Step: 1 Unlock blur-text-image
Question Has Been Solved by an Expert!

Get step-by-step solutions from verified subject matter experts

Step: 2 Unlock
Step: 3 Unlock

Students Have Also Explored These Related General Management Questions!