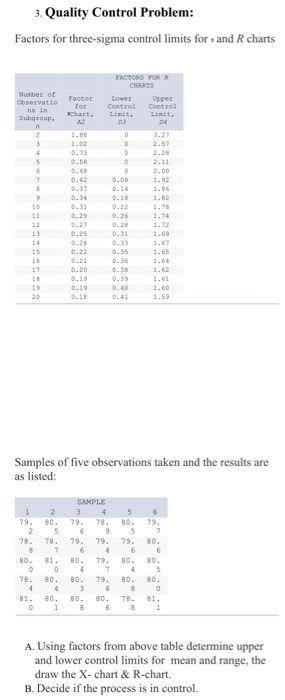
Question: 3. Quality Control Problem: Factors for three-sigma control limits for and R charts FACTORS PORR Number of Factor Subgroup, 0.48 0.37 0.27 1.64 0.20 0.38

3. Quality Control Problem: Factors for
3. Quality Control Problem: Factors for three-sigma control limits for and R charts FACTORS PORR Number of Factor Subgroup, 0.48 0.37 0.27 1.64 0.20 0.38 0.19 0.18 0.40 0.41 1.60 1.59 20 Samples of five observations taken and the results are as listed: 1 79. 2 80. 3 79. 4 78. 5 80. 6 79. 78. 78. 79. 79 79, 80 80. 81. 80. 79. 80. 80. 78. 80. 80. 79, 80 80 81. 80. 80. 80. 78. 81. A. Using factors from above table determine upper and lower control limits for mean and range, the draw the X-chart & R-chart. B. Decide if the process is in control

Step by Step Solution

There are 3 Steps involved in it

1 Expert Approved Answer
Step: 1 Unlock blur-text-image
Question Has Been Solved by an Expert!

Get step-by-step solutions from verified subject matter experts

Step: 2 Unlock
Step: 3 Unlock

Students Have Also Explored These Related General Management Questions!