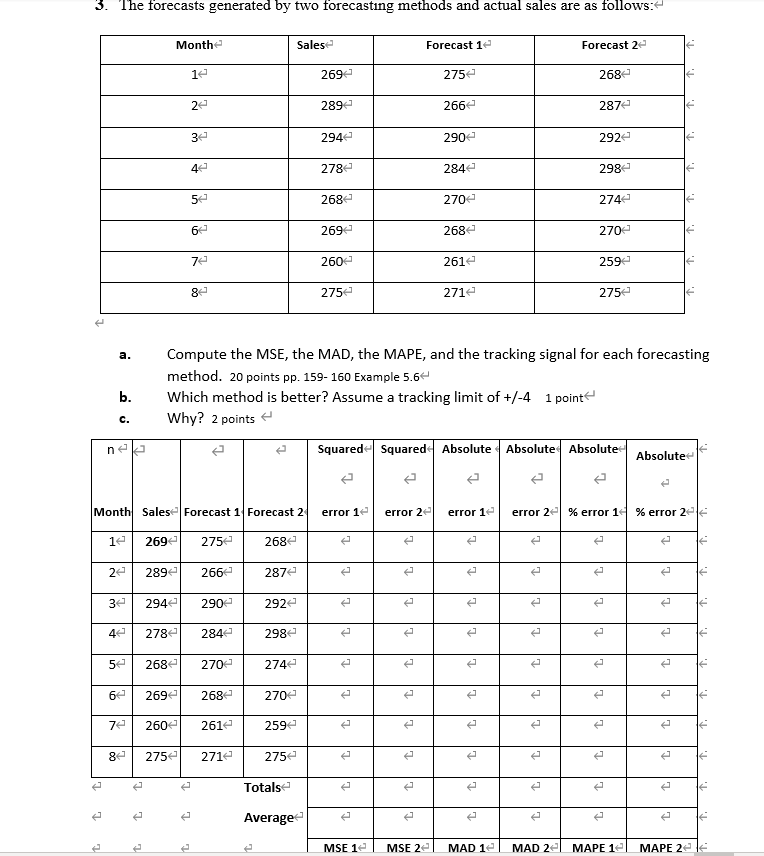
Question: 3. The forecasts generated by two forecasting methods and actual sales are as follows: Month Sales Forecast 1 Forecast 2 12 269 275 268 2

3. The forecasts generated by two forecasting

3. The forecasts generated by two forecasting methods and actual sales are as follows: Month Sales Forecast 1 Forecast 2 12 269 275 268 2 2892 266 2872 32 294 290 292 278 2842 298 50 268 270 274 6 269 268 270 ze 260 261 259 8 2752 2712 2752 a. Compute the MSE, the MAD, the MAPE, and the tracking signal for each forecasting method. 20 points pp. 159-160 Example 5.64 Which method is better? Assume a tracking limit of +/-4 1 point Why? 2 points b. c. nele Squared Squared Absolute Absolute Absolute Absolute Month Salese Forecast 1 Forecast 2 error 1e error 2 error 12 error 2 % error 10% error 2 1e 269 275 2682 2e 2892 266 2872 3e 294 290 2922 e 1 278 2842 298 5e 2682 270 274 1 2692 2682 270 t e za 260 2612 2592 2752 271 275e T t C Totals t T t t e Average e T e t t MSE 1e MSE 2 MAD 1 MAD 21 MAPE 12 MAPE 2le

Step by Step Solution

There are 3 Steps involved in it

1 Expert Approved Answer
Step: 1 Unlock blur-text-image
Question Has Been Solved by an Expert!

Get step-by-step solutions from verified subject matter experts

Step: 2 Unlock
Step: 3 Unlock

Students Have Also Explored These Related General Management Questions!