

Question: 3. The table below shows the particle size distribution data for Ottawa sand particles with particle density of 2640kg/m3 and loosely packed bed voidage of
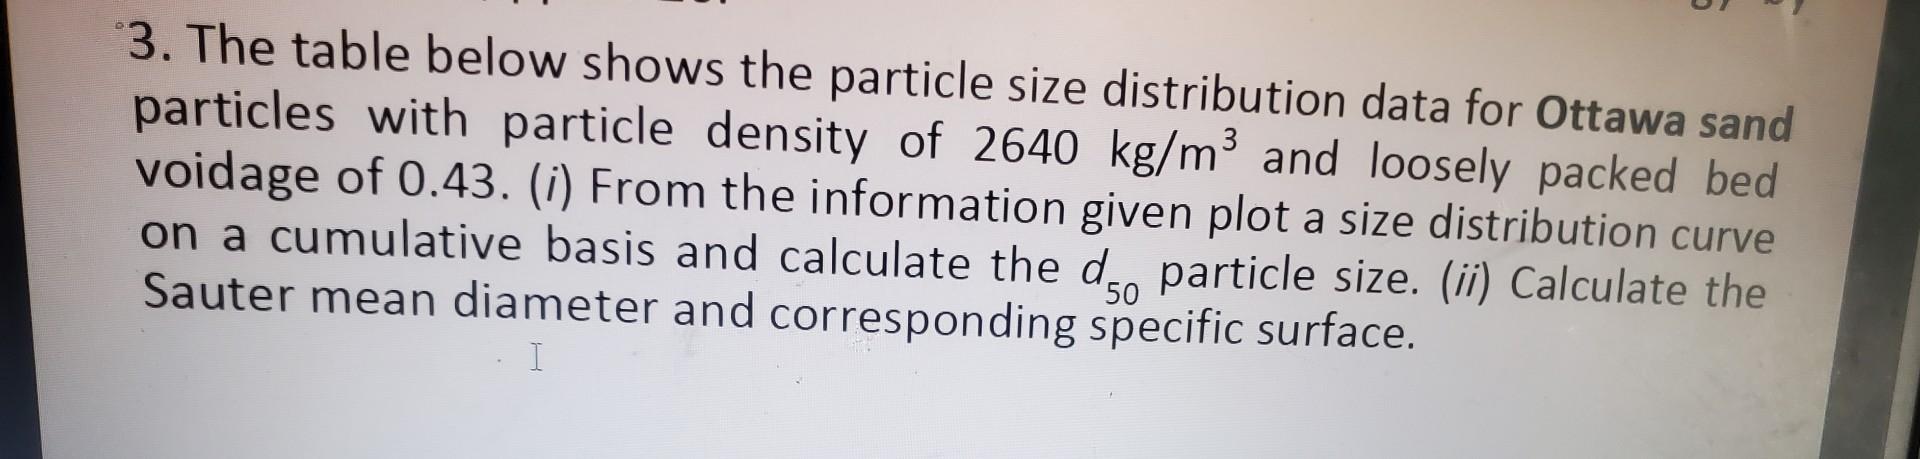
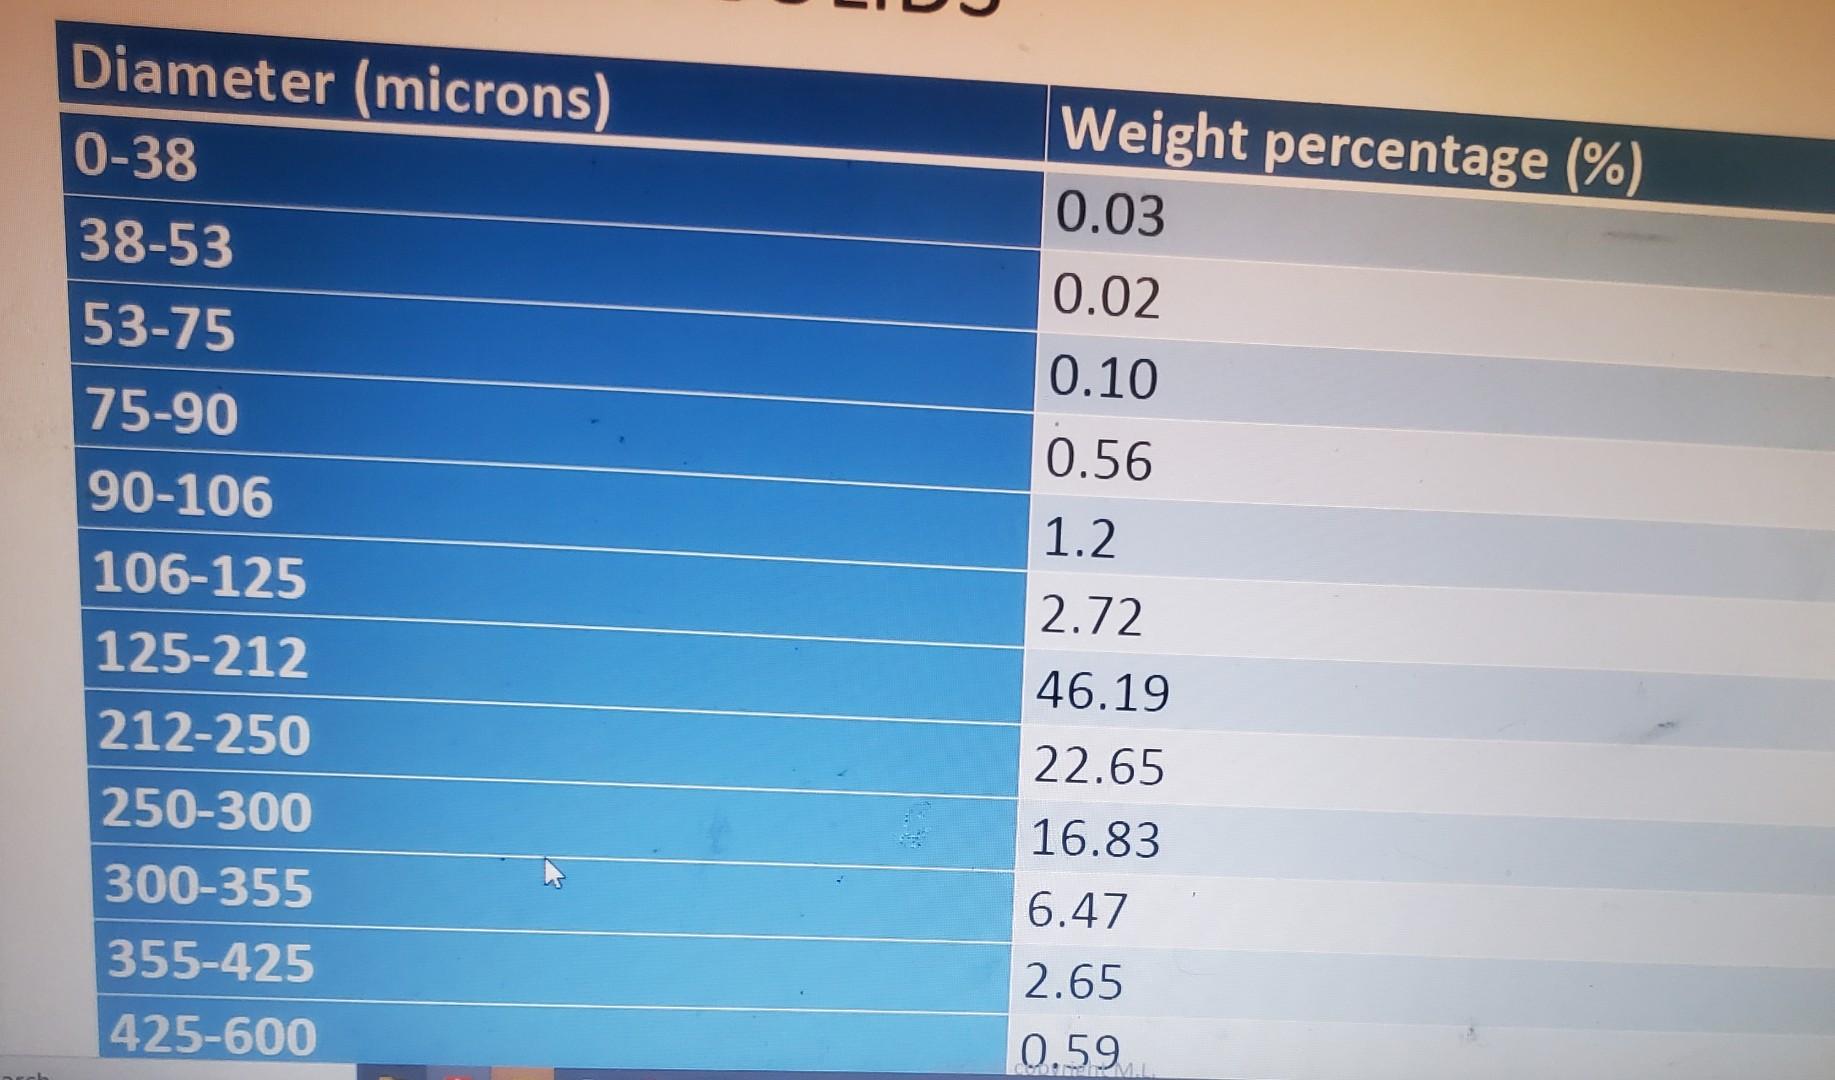
3. The table below shows the particle size distribution data for Ottawa sand particles with particle density of 2640kg/m3 and loosely packed bed voidage of 0.43. (i) From the information given plot a size distribution curve on a cumulative basis and calculate the d50 particle size. (ii) Calculate the Sauter mean diameter and corresponding specific surface. \begin{tabular}{|l|l|} \hline Diameter (microns) & Weight percentage (\%) \\ \hline 038 & 0.03 \\ \hline 3853 & 0.02 \\ \hline 5375 & 0.10 \\ \hline 7590 & 0.56 \\ \hline 90106 & 1.2 \\ \hline 106125 & 2.72 \\ \hline 125212 & 46.19 \\ \hline 212250 & 22.65 \\ \hline 250300 & 16.83 \\ \hline 300355 & 6.47 \\ \hline 355425 & 2.65 \\ \hline 425600 & 0.59 \end{tabular}
Step by Step Solution
There are 3 Steps involved in it

Get step-by-step solutions from verified subject matter experts