

Question: 3. This data from this article in the Colorado Sun about Colorado's hotels and restaurants during the initial stages of the pandemic: Time = (June
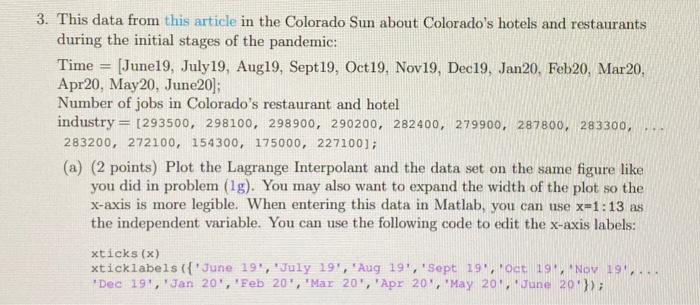

3. This data from this article in the Colorado Sun about Colorado's hotels and restaurants during the initial stages of the pandemic: Time = (June 19, July19, Aug19, Sept19, Oct19, Nov19, Dec 19, Jan 20, Feb 20, Mar20, Apr 20, May 20, June20]; Number of jobs in Colorado's restaurant and hotel industry = [293500, 298100, 298900, 290200, 282400, 279900, 287800, 283300, 283200, 272100, 154300, 175000, 227100); (a) (2 points) Plot the Lagrange Interpolant and the data set on the same figure like you did in problem (1g). You may also want to expand the width of the plot so the X-axis is more legible. When entering this data in Matlab, you can use x=1:13 as the independent variable. You can use the following code to edit the x-axis labels: xticks (x) xticklabels({ June 19', 'July 197, Aug 19, 'Sept 19,'oct 19 Nov 19,.. Dec 19",'Jan 20', 'Feb 20", "Mar 20', 'Apr 2012 May 20 June 20}); (c) (3 points) The plot we found isn't the plot that was used in the article; in fact, it is dramatically different. Do you think the Lagrange interpolant is reasonably trust- worthy to estimate the number of employees in restaurants and hotels in Colorado using this data set? Why do you think so? Discuss the impact of the number of data points
Step by Step Solution
There are 3 Steps involved in it

Get step-by-step solutions from verified subject matter experts