

Question: Please type the answer 2. This data from this article in the Colorado Sun about Colorado's restaurant and bars during the initial stages of the
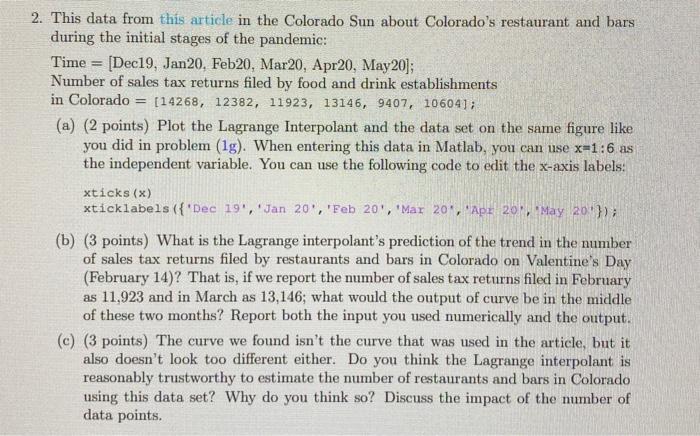
2. This data from this article in the Colorado Sun about Colorado's restaurant and bars during the initial stages of the pandemic: Time = [Dec19, Jan20. Feb20, Mar20, Apr20, May 20]; Number of sales tax returns filed by food and drink establishments in Colorado [14268, 12382, 11923, 13146, 9407, 106041; (a) (2 points) Plot the Lagrange Interpolant and the data set on the same figure like you did in problem (1g). When entering this data in Matlab, you can use x=1:6 as the independent variable. You can use the following code to edit the x-axis labels: xticks (x) xticklabels({'Dec 19','Jan 20', 'Feb 20', 'Mar 20, 'Ape 20 May 20*}); (b) (3 points) What is the Lagrange interpolant's prediction of the trend in the number of sales tax returns filed by restaurants and bars in Colorado on Valentine's Day (February 14)? That is, if we report the number of sales tax returns filed in February as 11,923 and in March as 13, 146; what would the output of curve be in the middle of these two months? Report both the input you used numerically and the output. (c) (3 points) The curve we found isn't the curve that was used in the article, but it also doesn't look too different either. Do you think the Lagrange interpolant is reasonably trustworthy to estimate the number of restaurants and bars in Colorado using this data set? Why do you think so? Discuss the impact of the number of data points
Step by Step Solution
There are 3 Steps involved in it

Get step-by-step solutions from verified subject matter experts