

Question: 3. Use Excel to create a GIS chart. To do this you will need to create a 3D Map in Excel. Take screenshots of the
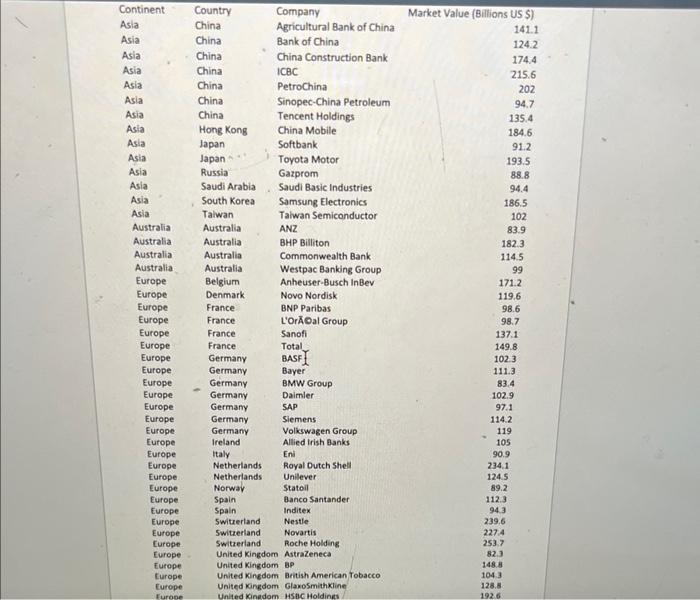
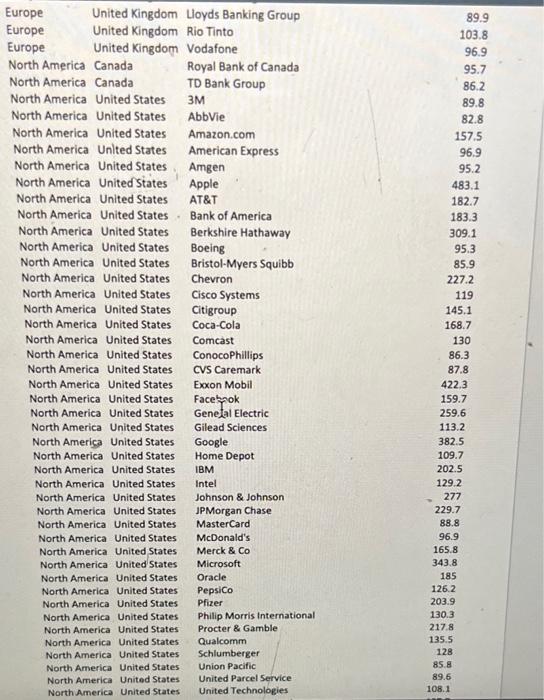
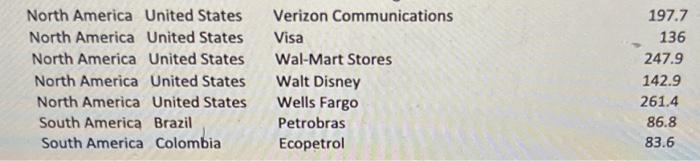
3. Use Excel to create a GIS chart. To do this you will need to create a 3D Map in Excel. Take screenshots of the maps \& past them on the spreadheet. 4+2=6 a. Display the results of the GIS iart for companies in Europe only. Which country in Europe has the highest total Market Value for Global 100 companies in that country? b. Add North America in addition to Europe for continents to be displayed. How does the heat map for Europe change? Why does it change in this way? 3. Use Excel to create a GIS chart. To do this you will need to create a 3D Map in Excel. Take screenshots of the maps \& past them on the spreadheet. 4+2=6 a. Display the results of the GIS iart for companies in Europe only. Which country in Europe has the highest total Market Value for Global 100 companies in that country? b. Add North America in addition to Europe for continents to be displayed. How does the heat map for Europe change? Why does it change in this way
Step by Step Solution
There are 3 Steps involved in it

Get step-by-step solutions from verified subject matter experts