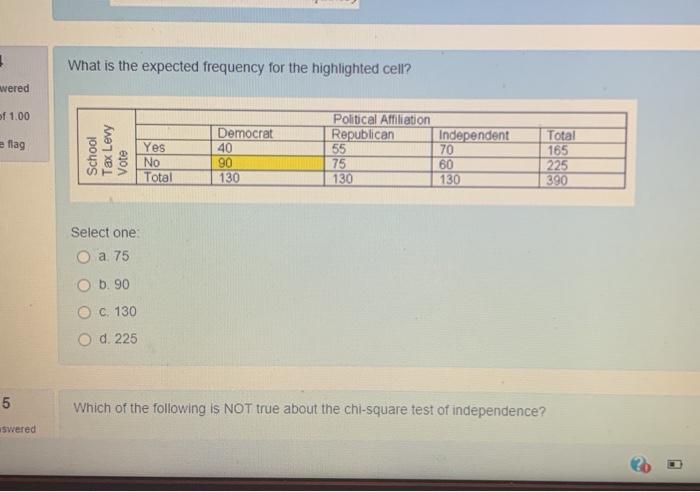
Question: 3 What is the expected frequency for the highlighted cell? wwered f 1.00 e flag Yes No Total Democrat 40 90 130 Political Affiliation Republican

3 What is the expected frequency for the
3 What is the expected frequency for the highlighted cell? wwered f 1.00 e flag Yes No Total Democrat 40 90 130 Political Affiliation Republican Independent 55 70 75 60 130 130 Total 165 225 390 Select one O a 75 O b. 90 O c. 130 O d. 225 5 LO Which of the following is NOT true about the chi-square test of independence? swered

Step by Step Solution

There are 3 Steps involved in it

1 Expert Approved Answer
Step: 1 Unlock blur-text-image
Question Has Been Solved by an Expert!

Get step-by-step solutions from verified subject matter experts

Step: 2 Unlock
Step: 3 Unlock

Students Have Also Explored These Related General Management Questions!