

Question: 3.2 EXERCISES 1. The graph of a function f is shown. Verify that f satisfies the 3. The graph of a function g is shown.

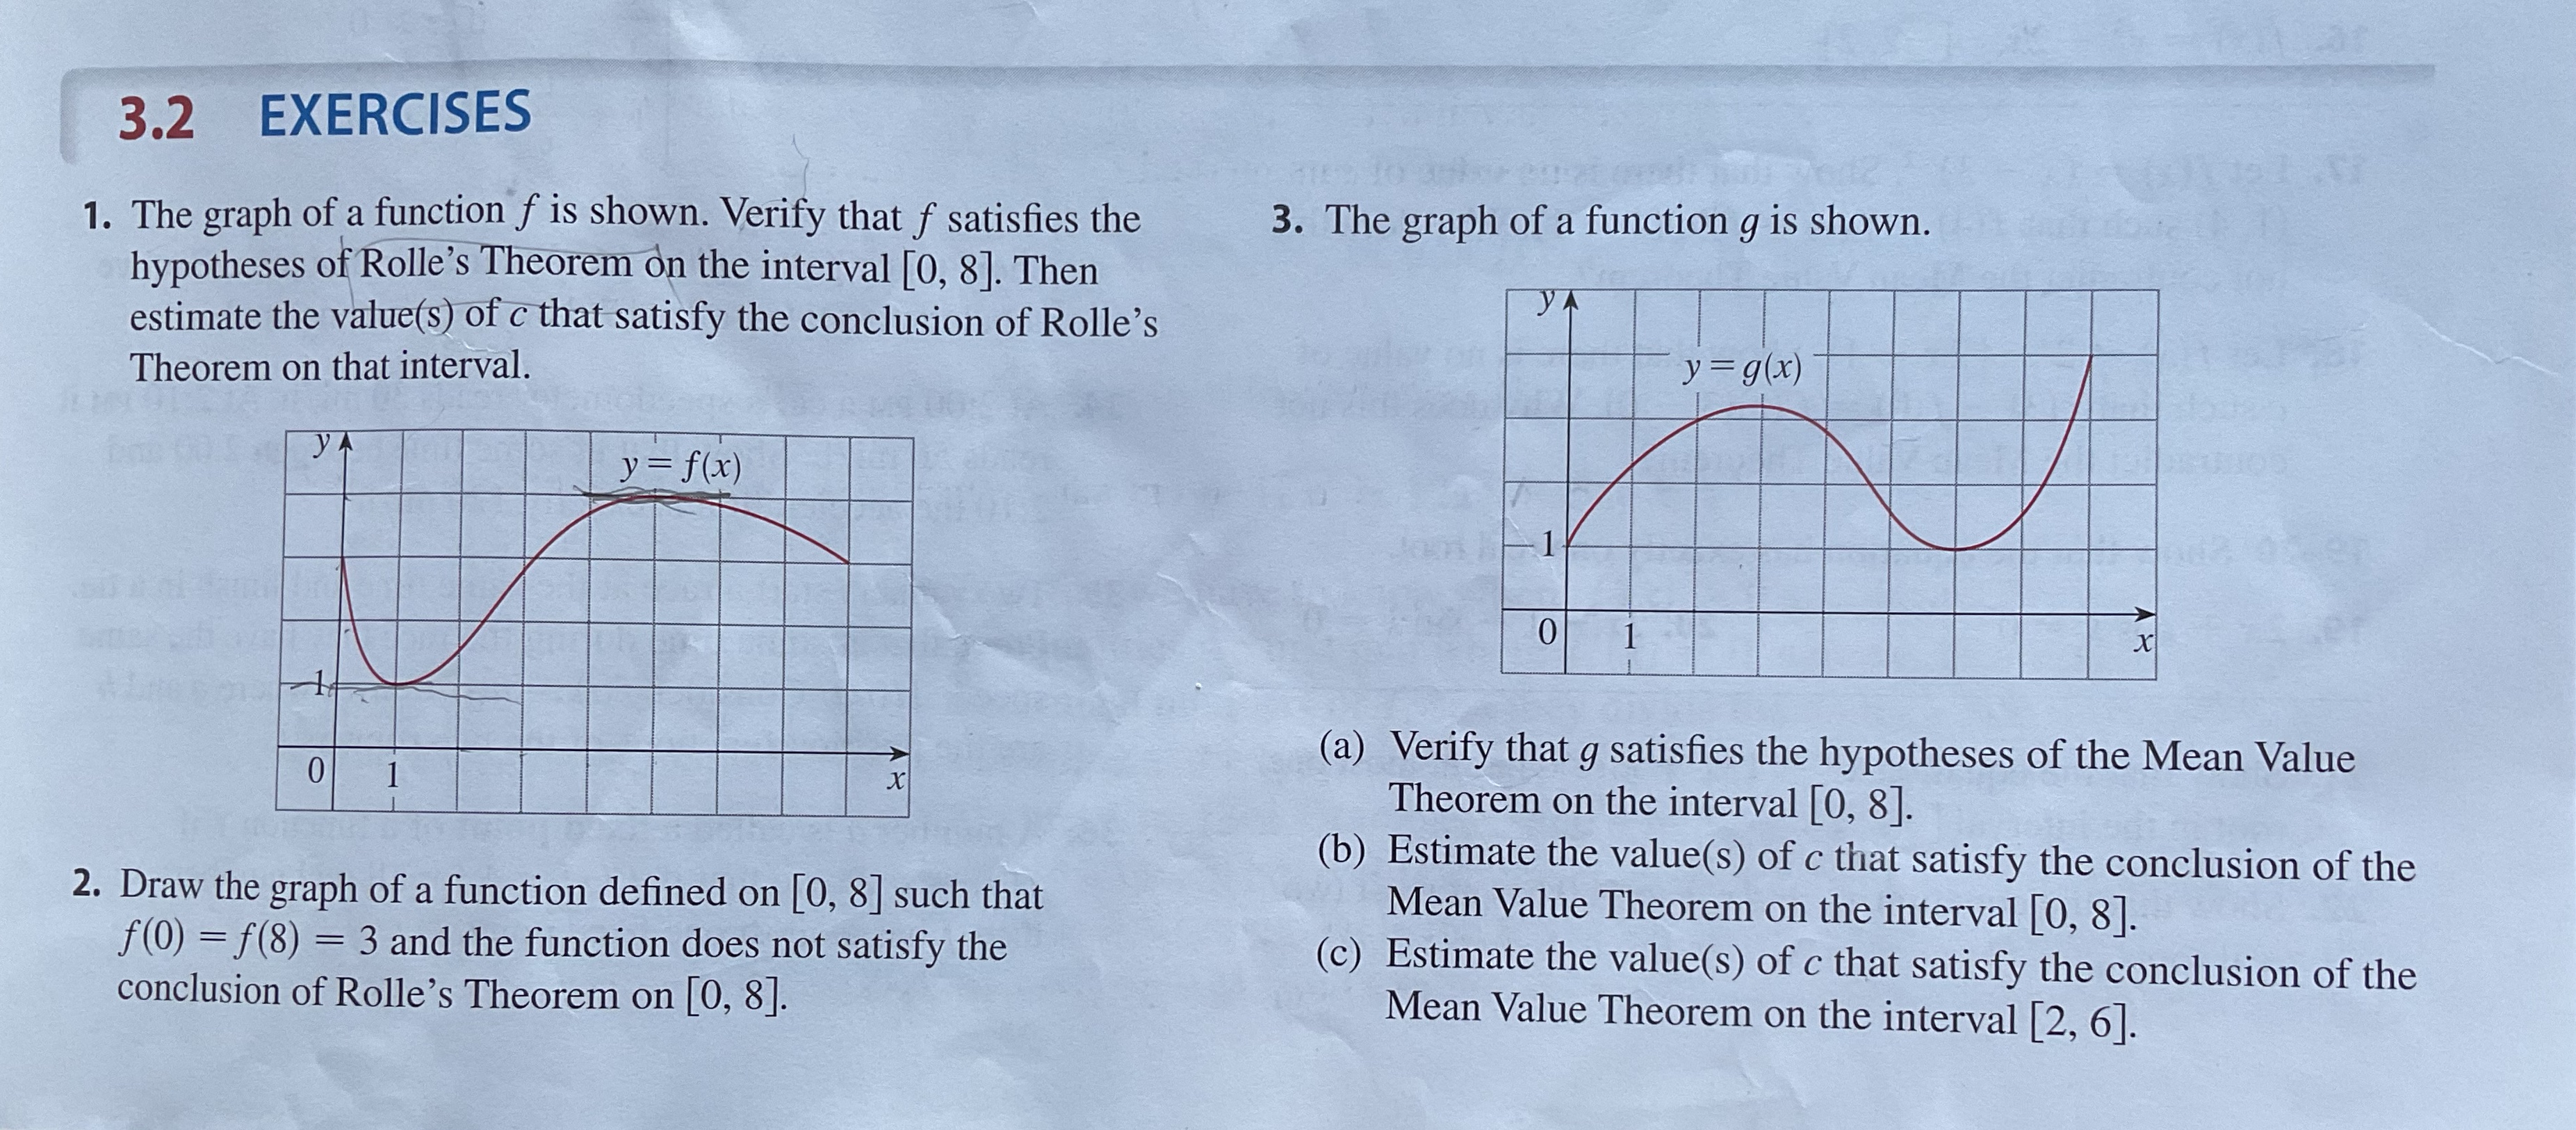
3.2 EXERCISES 1. The graph of a function f is shown. Verify that f satisfies the 3. The graph of a function g is shown. hypotheses of Rolle's Theorem on the interval [0, 8]. Then estimate the value(s) of c that satisfy the conclusion of Rolle's Theorem on that interval. y = g(x) y = f(x) 0 X (a) Verify that g satisfies the hypotheses of the Mean Value Theorem on the interval [0, 8]. (b) Estimate the value(s) of c that satisfy the conclusion of the 2. Draw the graph of a function defined on [0, 8] such that Mean Value Theorem on the interval [0, 8]. f (0) = f(8) = 3 and the function does not satisfy the (c) Estimate the value(s) of c that satisfy the conclusion of the conclusion of Rolle's Theorem on [0, 8]. Mean Value Theorem on the interval [2, 6]
Step by Step Solution
There are 3 Steps involved in it

Get step-by-step solutions from verified subject matter experts