

Question: 3.4 Problem Solving Tasks (8 marks) 3.4.1 Task 1 (3 marks) Consider the following table, which shows when each of the processes arrives to the
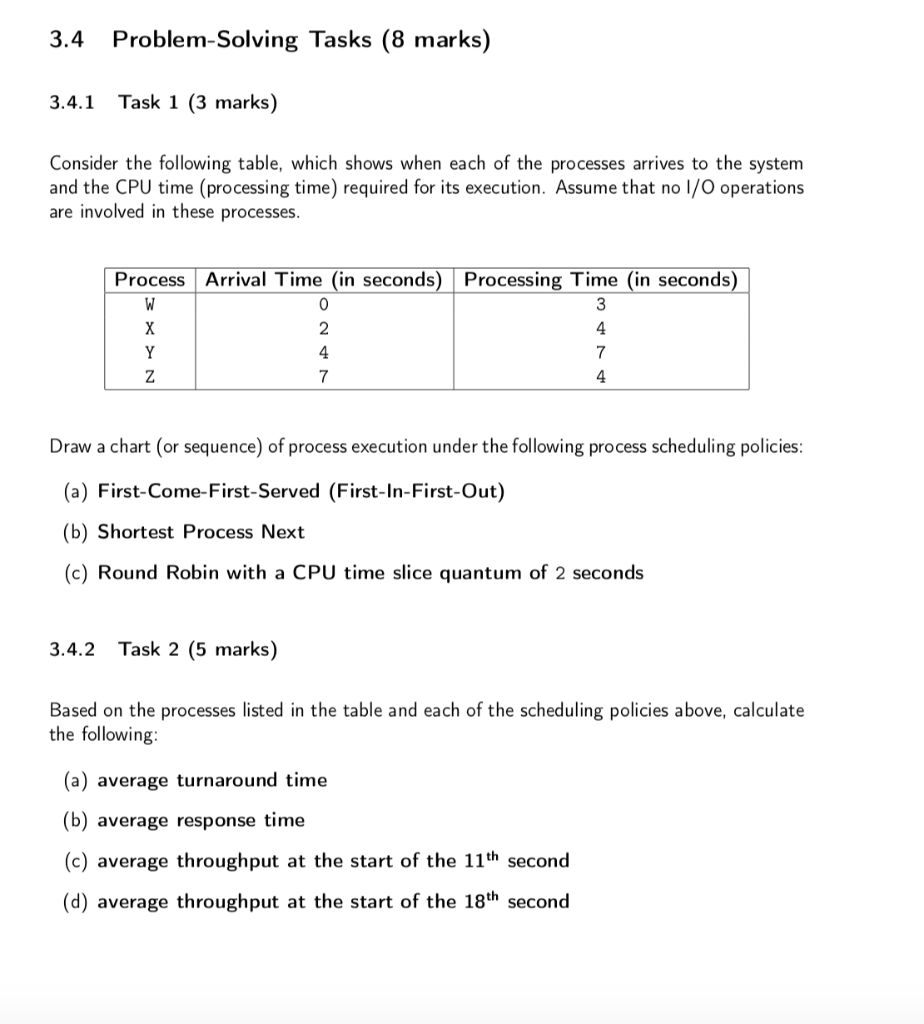
3.4 Problem Solving Tasks (8 marks) 3.4.1 Task 1 (3 marks) Consider the following table, which shows when each of the processes arrives to the system and the CPU time (processing time) required for its execution. Assume that no 1/O operations are involved in these processes. Process Arrival Time (in seconds) Processing Time (in seconds) W 0 3 X 2 4 Y 4 7 z 7 4 Draw a chart (or sequence) of process execution under the following process scheduling policies: (a) First-Come-First-Served (First-In-First-Out) (b) Shortest Process Next (c) Round Robin with a CPU time slice quantum of 2 seconds 3.4.2 Task 2 (5 marks) Based on the processes listed in the table and each of the scheduling policies above, calculate the following: (a) average turnaround time (b) average response time (c) average throughput at the start of the 11th second (d) average throughput at the start of the 18th second
Step by Step Solution
There are 3 Steps involved in it

Get step-by-step solutions from verified subject matter experts