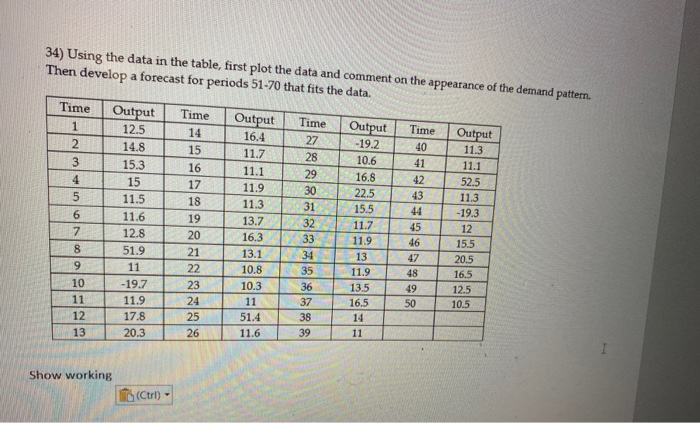
Question: 34) Using the data in the table, first plot the data and comment on the appearance of the demand pattern. Then develop a forecast for

34) Using the data in the table, first plot the
34) Using the data in the table, first plot the data and comment on the appearance of the demand pattern. Then develop a forecast for periods 51-70 that fits the data. Time Output 12.5 Time 14 15 Output 16.4 Time 27 28 11.1 29 Output -19.2 10.6 16,8 22.5 15.5 11. 7 11.9 13 11. 9 135 16.5 Time Output 40 11.3 41 11.1 42 52.5 43 11.3 44 -19.3 4512 46 15.5 47 20.5 48 16.5 49 12.5 50 10.5 51.9 11.9 11.3 13.7 16.3 13.1 10.8 10.3 11 51. 4 11.6 8 9 10 11 12 13 19 20 21 22 23 24 25 26 11 -19,7 11.9 17.8 1 3 33 34 35 36 37 38 39 | 11 20.3 Show working (Ctrl)

Step by Step Solution

There are 3 Steps involved in it

1 Expert Approved Answer
Step: 1 Unlock blur-text-image
Question Has Been Solved by an Expert!

Get step-by-step solutions from verified subject matter experts

Step: 2 Unlock
Step: 3 Unlock

Students Have Also Explored These Related General Management Questions!