

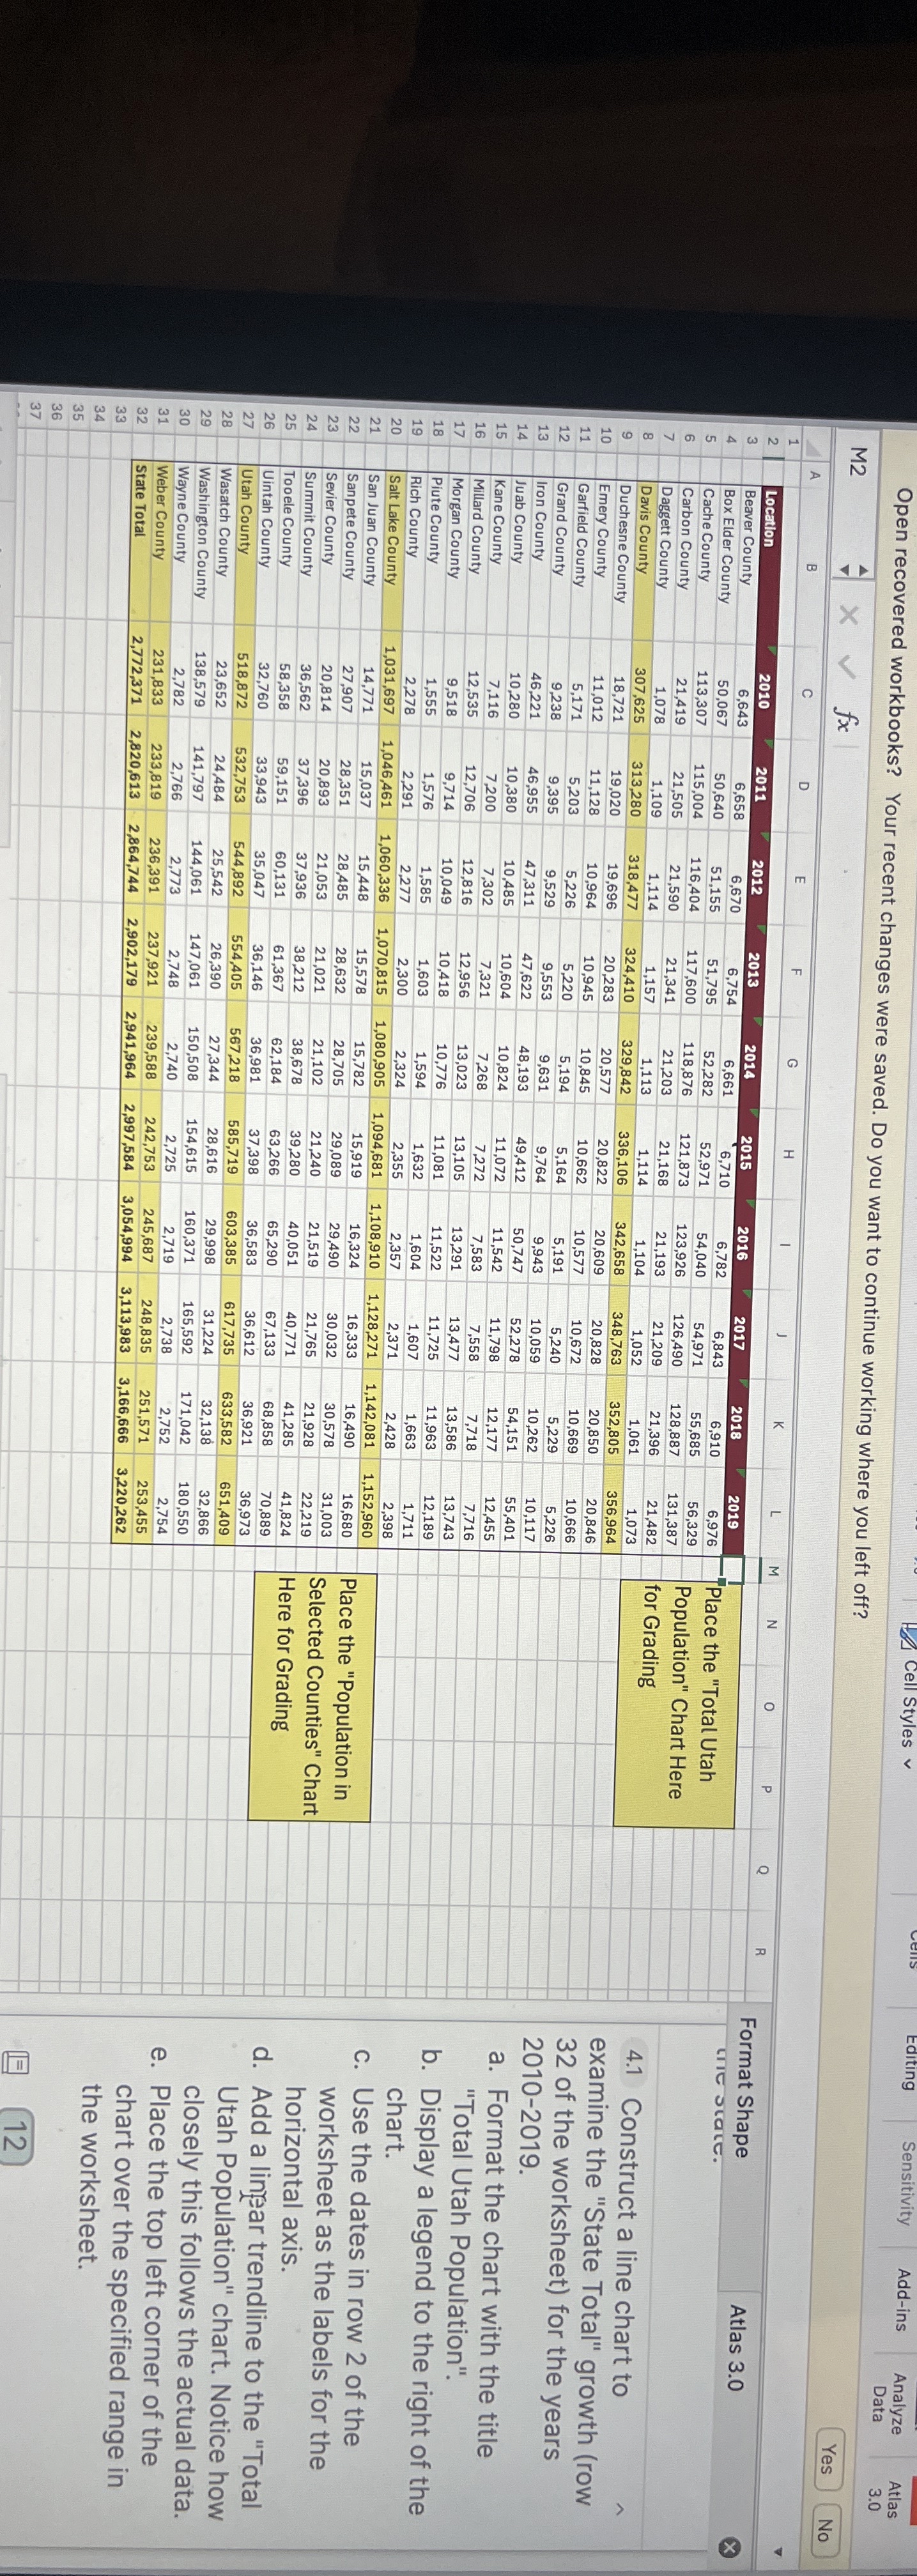
Question: 4 . 1 Construct a line chart to examine the State Total growth ( row 3 2 of the worksheet ) for the years 2
Construct a line chart to
examine the "State Total" growth row
of the worksheet for the years
a Format the chart with the title
"Total Utah Population".
b Display a legend to the right of the
chart.
c Use the dates in row of the
worksheet as the labels for the
horizontal axis.
d Add a lingar trendline to the "Total
Utah Population" chart. Notice how
closely this follows the actual data.
e Place the top left corner of the
chart over the specified range in
the worksheet.
Construct a line chart to
Step by Step Solution
There are 3 Steps involved in it
1 Expert Approved Answer
Step: 1 Unlock

Question Has Been Solved by an Expert!
Get step-by-step solutions from verified subject matter experts
Step: 2 Unlock
Step: 3 Unlock