

Question: 4 2.1 Construct a frequency distribution and a frequency histogram for the data set using Construct a frequency distribution of the data. Use the minimum
4 2.1
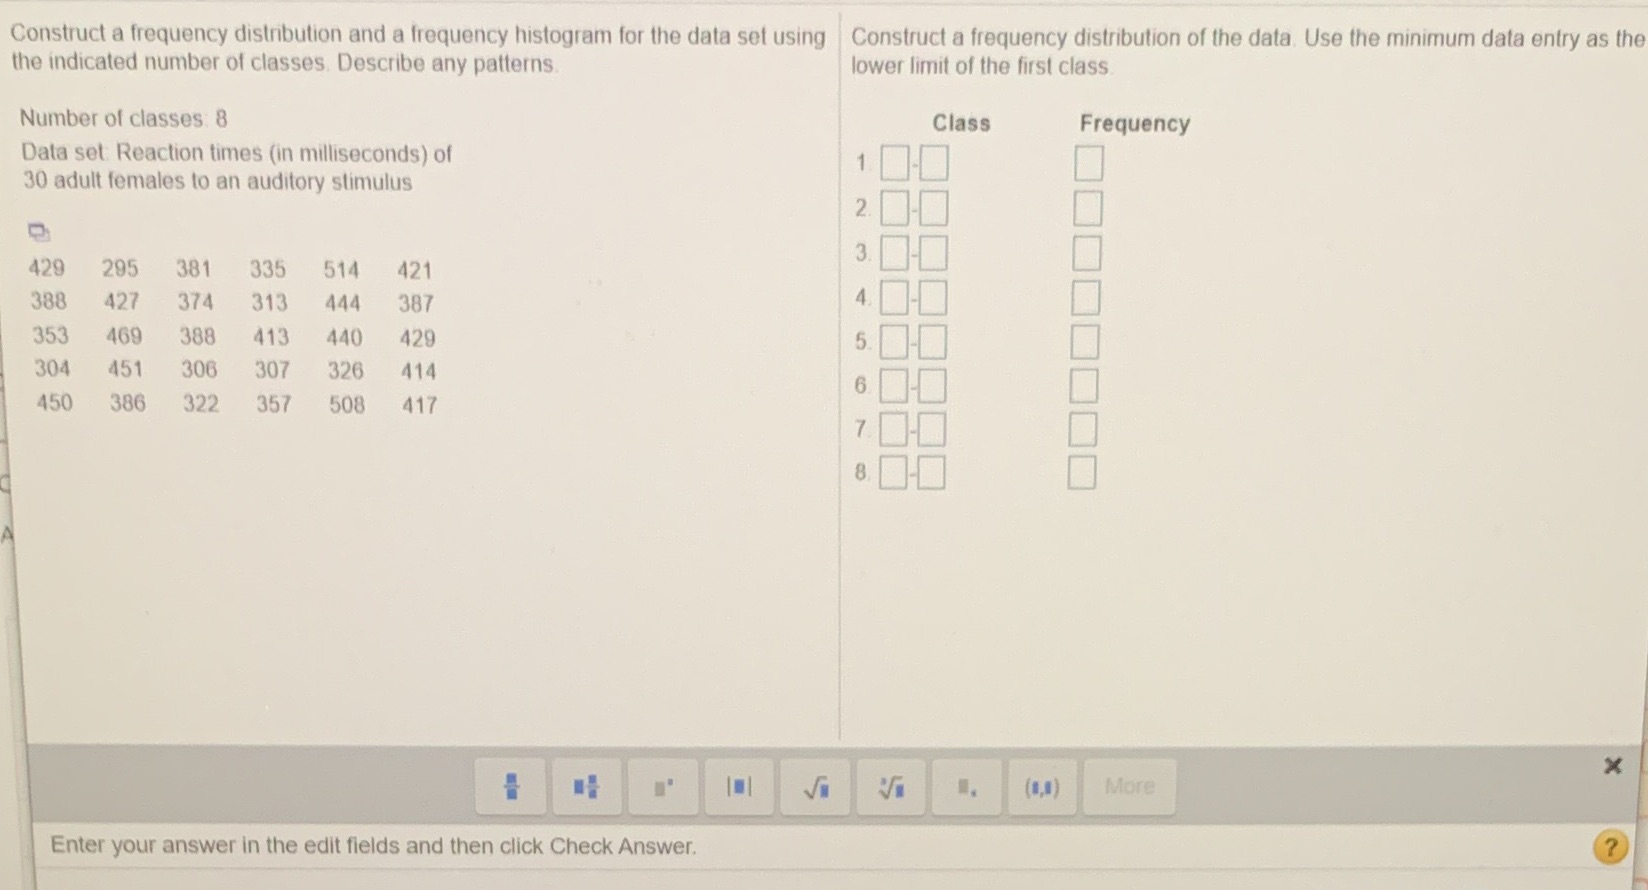
Construct a frequency distribution and a frequency histogram for the data set using Construct a frequency distribution of the data. Use the minimum data entry as the the indicated number of classes. Describe any patterns. lower limit of the first class Number of classes: 8 Class Frequency Data set: Reaction times (in milliseconds) of 30 adult females to an auditory stimulus 100 2. 3. 429 295 381 335 514 421 388 427 374 313 444 387 353 469 388 413 440 429 304 451 306 307 326 414 6. 450 386 322 357 508 417 7. 8. X (1,1) More Enter your answer in the edit fields and then click Check
Step by Step Solution
There are 3 Steps involved in it
1 Expert Approved Answer
Step: 1 Unlock

Question Has Been Solved by an Expert!
Get step-by-step solutions from verified subject matter experts
Step: 2 Unlock
Step: 3 Unlock