

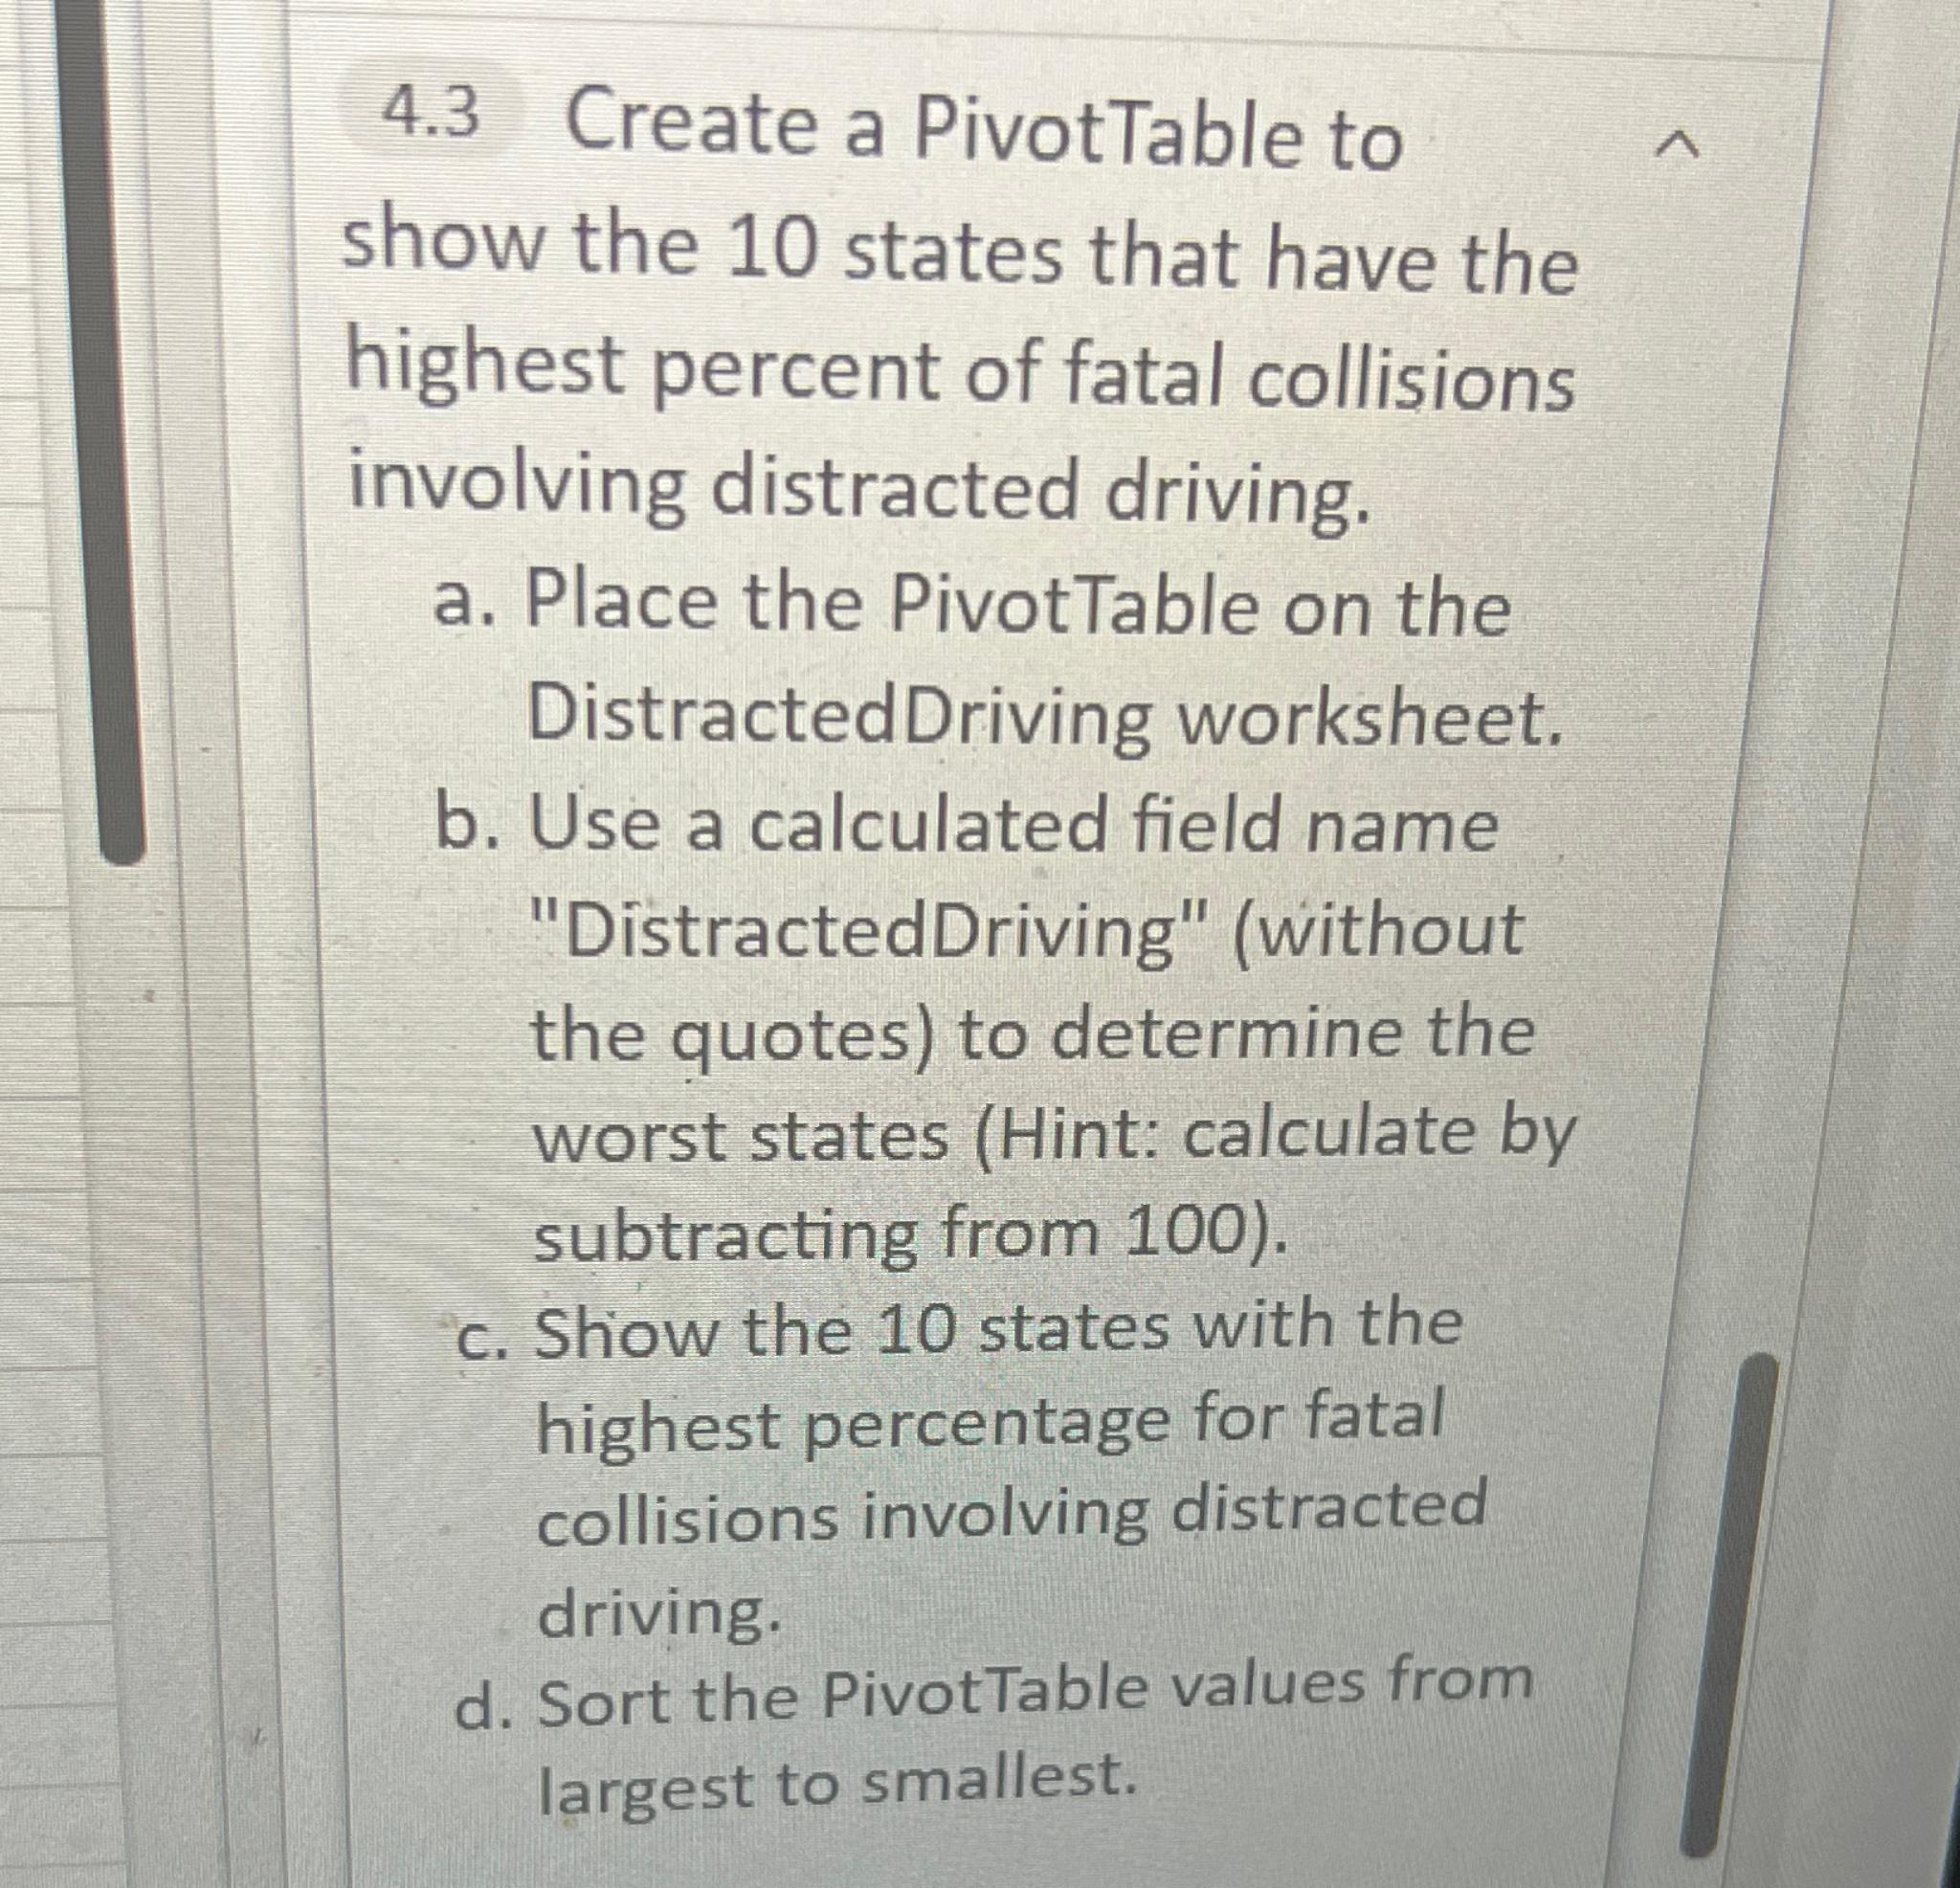
Question: 4 . 3 Create a PivotTable to show the 1 0 states that have the highest percent of fatal collisions involving distracted driving. a .
Create a PivotTable to show the states that have the highest percent of fatal collisions involving distracted driving.
a Place the PivotTable on the DistractedDriving worksheet.
b Use a calculated field name "DistractedDriving" without the quotes to determine the worst states Hint: calculate by subtracting from
c Show the states with the highest percentage for fatal collisions involving distracted driving.
d Sort the PivotTable values from largest to smallest.
Step by Step Solution
There are 3 Steps involved in it
1 Expert Approved Answer
Step: 1 Unlock

Question Has Been Solved by an Expert!
Get step-by-step solutions from verified subject matter experts
Step: 2 Unlock
Step: 3 Unlock