

Question: 4.1 Create a PivotTable on the Speeders worksheet. a. Show the 5 worst states for fatal collisions involving speeding. b. Sort the PivotTable values from
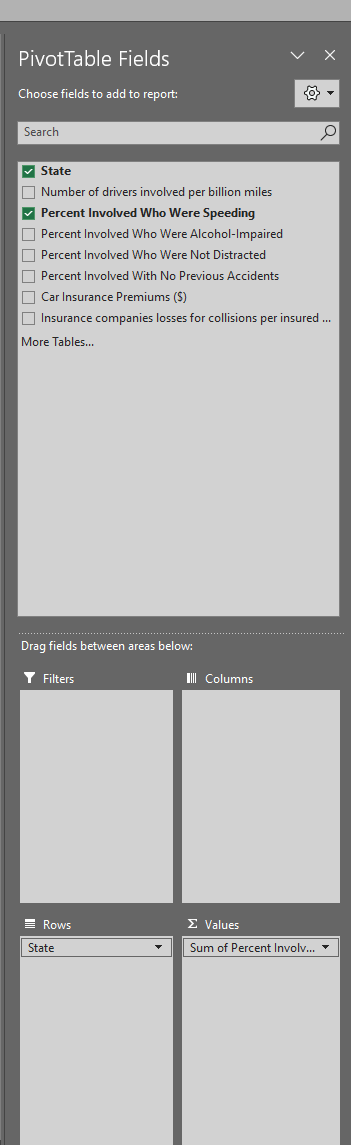
4.1 Create a PivotTable on the Speeders worksheet.
a. Show the 5 worst states for fatal collisions involving speeding.
b. Sort the PivotTable values from largest to smallest.
How do I do steps A and B?
State Number of drivers involved per billion miles Percent Involved Who Were Speeding Percent Involved Who Were Alcohol-Impaired Percent Involved Who Were Not Distracted Percent Involved With No Previous Accidents Car Insurance Premiums ( $ ) Insurance companies losses for collisions per insured ... More Tables
Step by Step Solution
There are 3 Steps involved in it
1 Expert Approved Answer
Step: 1 Unlock

Question Has Been Solved by an Expert!
Get step-by-step solutions from verified subject matter experts
Step: 2 Unlock
Step: 3 Unlock