

Question: 4. (40%) Based on the data given below for a company that produces 6 different products in 9 equal sized departments (placed in a 3
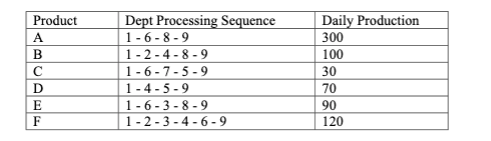
4. (40%) Based on the data given below for a company that produces 6 different products in 9 equal sized departments (placed in a 3 x 3 grid - each department is 1 x 1), (a) develop an aggregate From-To chart assume a unit load size = 10) and comment on the Flow Analysis Difficulty based on the factors discussed in class. Product A B D E F Dept Processing Sequence 1-6-8-9 1-2-4-8-9 1-6-7-5-9 1-4-5-9 1-6-3-8-9 1-2-3-4-6-9 Daily Production 300 100 30 70 90 120
Step by Step Solution
There are 3 Steps involved in it
1 Expert Approved Answer
Step: 1 Unlock

Question Has Been Solved by an Expert!
Get step-by-step solutions from verified subject matter experts
Step: 2 Unlock
Step: 3 Unlock