

Question: 4. (40%) Based on the data given below for a company that produces 6 different products in 9 equal sized departments (placed in a 3
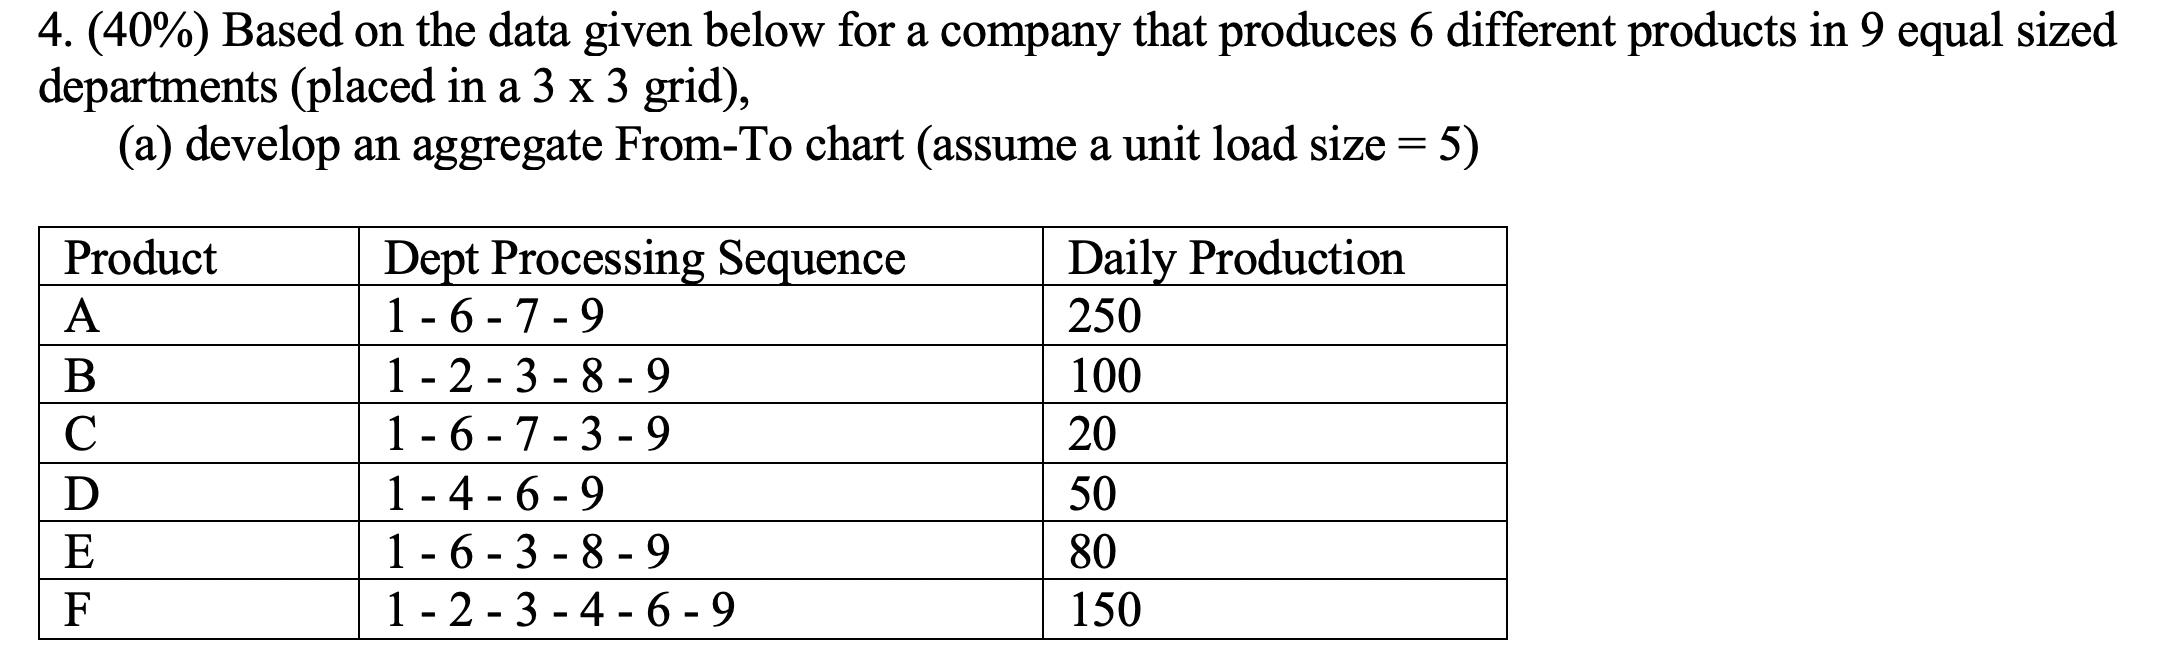
4. (40%) Based on the data given below for a company that produces 6 different products in 9 equal sized departments (placed in a 3 x 3 grid), (a) develop an aggregate From-To chart (assume a unit load size = 5) Product Daily Production 250 100 B Dept Processing Sequence 1 - 6- 7-9 | 1 - 2 - 3 - 8 - 9 | 1 - 6 - 7 -3 -9 1-4-6-9 1 - 6 - 3-8-9 | 1 - 2 - 3 - 4 - 6-9 20 50 80 150 4. (40%) Based on the data given below for a company that produces 6 different products in 9 equal sized departments (placed in a 3 x 3 grid), (a) develop an aggregate From-To chart (assume a unit load size = 5) Product Daily Production 250 100 B Dept Processing Sequence 1 - 6- 7-9 | 1 - 2 - 3 - 8 - 9 | 1 - 6 - 7 -3 -9 1-4-6-9 1 - 6 - 3-8-9 | 1 - 2 - 3 - 4 - 6-9 20 50 80 150
Step by Step Solution
There are 3 Steps involved in it

Get step-by-step solutions from verified subject matter experts