Question: 4. (40%) Based on the data given below for a company that produces 6 different products in 9 equal sized departments (placed in a 3
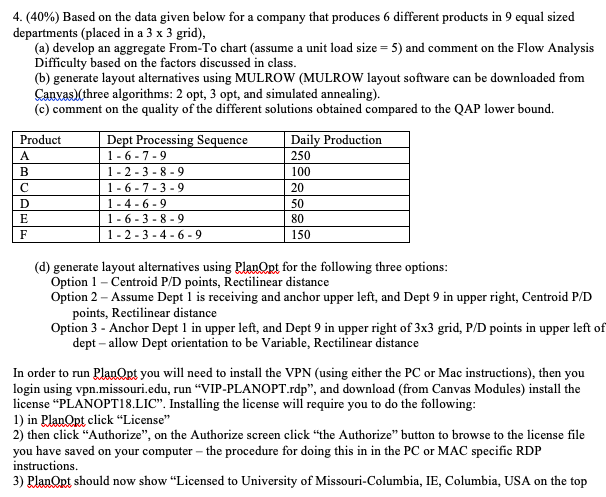
4. (40%) Based on the data given below for a company that produces 6 different products in 9 equal sized departments (placed in a 3 x 3 grid), (a) develop an aggregate From-To chart (assume a unit load size = 5) and comment on the Flow Analysis Difficulty based on the factors discussed in class. (b) generate layout alternatives using MULROW (MULROW layout software can be downloaded from Canvas) (three algorithms: 2 opt, 3 opt, and simulated annealing). (c) comment on the quality of the different solutions obtained compared to the QAP lower bound. Product Dept Processing Sequence 1-6-7-9 1-2-3-8-9 1 - 6 - 7 - 3 - 9 1-4-6-9 1 - 6-3 - 8 - 9 | 1 - 2 - 3 - 4 - 6 - 9 Daily Production 250 100 20 B 50 80 150 (d) generate layout alternatives using PlanOpt for the following three options: Option 1 - Centroid P/D points, Rectilinear distance Option 2 - Assume Dept 1 is receiving and anchor upper left, and Dept 9 in upper right, Centroid P/D points, Rectilinear distance Option 3 - Anchor Dept 1 in upper left, and Dept 9 in upper right of 3x3 grid, P/D points in upper left of dept - allow Dept orientation to be Variable, Rectilinear distance In order to run PlanOpt you will need to install the VPN (using either the PC or Mac instructions), then you login using vpn.missouri.edu, run "VIP-PLANOPT.rdp", and download (from Canvas Modules) install the license "PLANOPT18.LIC". Installing the license will require you to do the following: 1) in PlanOpt click "License" 2) then click "Authorize", on the Authorize screen click the Authorize" button to browse to the license file you have saved on your computer - the procedure for doing this in in the PC or MAC specific RDP instructions. 3) PlanOrt should now show "Licensed to University of Missouri-Columbia, IE, Columbia, USA on the top 4. (40%) Based on the data given below for a company that produces 6 different products in 9 equal sized departments (placed in a 3 x 3 grid), (a) develop an aggregate From-To chart (assume a unit load size = 5) and comment on the Flow Analysis Difficulty based on the factors discussed in class. (b) generate layout alternatives using MULROW (MULROW layout software can be downloaded from Canvas) (three algorithms: 2 opt, 3 opt, and simulated annealing). (c) comment on the quality of the different solutions obtained compared to the QAP lower bound. Product Dept Processing Sequence 1-6-7-9 1-2-3-8-9 1 - 6 - 7 - 3 - 9 1-4-6-9 1 - 6-3 - 8 - 9 | 1 - 2 - 3 - 4 - 6 - 9 Daily Production 250 100 20 B 50 80 150 (d) generate layout alternatives using PlanOpt for the following three options: Option 1 - Centroid P/D points, Rectilinear distance Option 2 - Assume Dept 1 is receiving and anchor upper left, and Dept 9 in upper right, Centroid P/D points, Rectilinear distance Option 3 - Anchor Dept 1 in upper left, and Dept 9 in upper right of 3x3 grid, P/D points in upper left of dept - allow Dept orientation to be Variable, Rectilinear distance In order to run PlanOpt you will need to install the VPN (using either the PC or Mac instructions), then you login using vpn.missouri.edu, run "VIP-PLANOPT.rdp", and download (from Canvas Modules) install the license "PLANOPT18.LIC". Installing the license will require you to do the following: 1) in PlanOpt click "License" 2) then click "Authorize", on the Authorize screen click the Authorize" button to browse to the license file you have saved on your computer - the procedure for doing this in in the PC or MAC specific RDP instructions. 3) PlanOrt should now show "Licensed to University of Missouri-Columbia, IE, Columbia, USA on the top


