

Question: 4 ( 6 ) = 35 ( K( + ) ] [ L ( + ] ]05 In per capita terms y ( 6 )
![4 ( 6 ) = 35 ( K( + ) ]](https://dsd5zvtm8ll6.cloudfront.net/si.experts.images/questions/2024/09/66f6bdd873eef_48766f6bdd7f1f8c.jpg)
![[ L ( + ] ]05 In per capita terms y (](https://dsd5zvtm8ll6.cloudfront.net/si.experts.images/questions/2024/09/66f6bdd9238fd_48866f6bdd8d1724.jpg)
![6 ) = 35 [ RC ) ]os where (y(t ) 2](https://dsd5zvtm8ll6.cloudfront.net/si.experts.images/questions/2024/09/66f6bdd9bdd0c_48966f6bdd99577b.jpg)
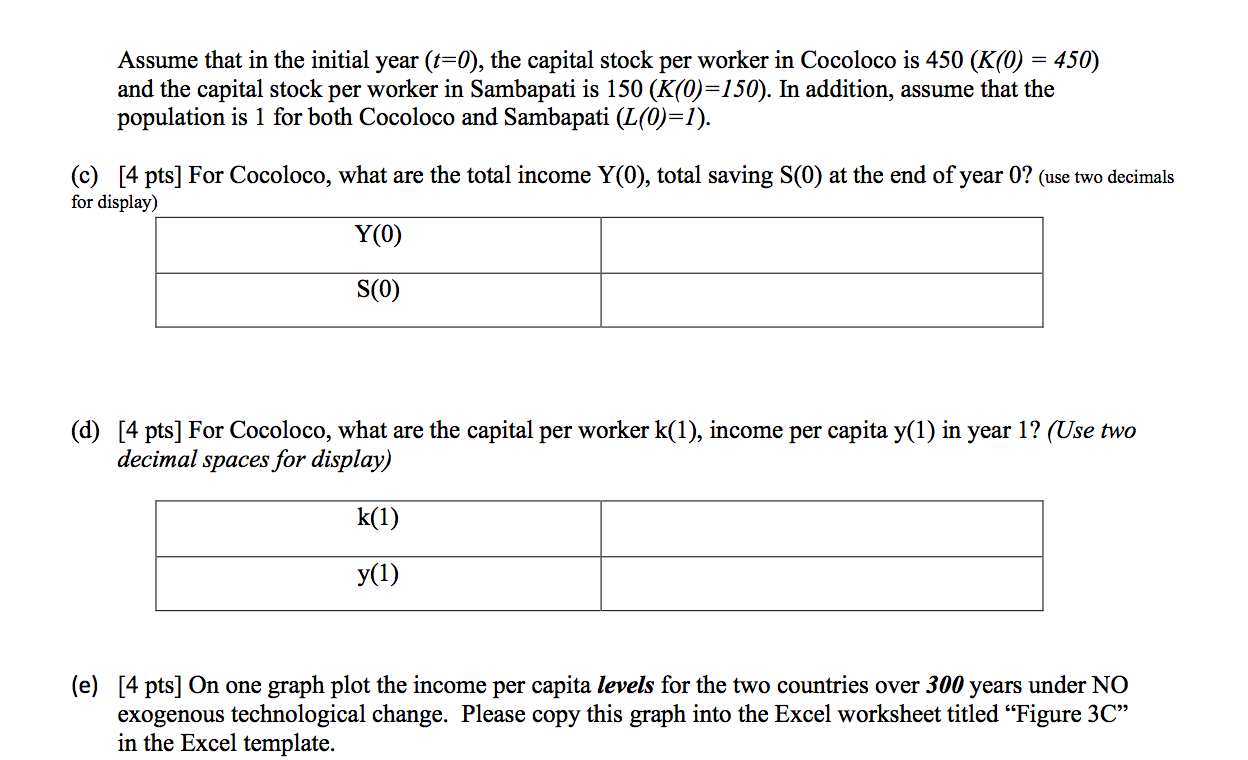

4 ( 6 ) = 35 ( K( + ) ] [ L ( + ] ]05 In per capita terms y ( 6 ) = 35 [ RC ) ]os where (y(t ) 2 Y (t) L ( t ) k ( ) = KC) 85 = 0. 18 LLt) 1 = 0.009 d = 0.016 Butterflow (ca ) Production in pea- capita teams divide fad by 1( t ), wale get Y(+ ) / L() = 35 [K(t )70-5 [LICE] / LICE ) y (+ ) = 35 [ RUG ) 5 210 .0- 60)4 :109 Steady State RTH = Rx- dR+ + +10 RTH = RX - 0.016 kx + 0- 18 ( 35 Ret ) At steady estate RAH - RE = R) , 80 RX = R - 0.016 R + 0-18 ( 35 RXOS) 0 . 016 k = 0.18 ( 35 ) R * 0.5 R = ( 393.75 )2 = (393. 75 ) OR yos = 13781.25 45 = 18781.25\fAssume that we live in an imaginary world where there are two countries: Cocoloco and Sambapati. These two countries have the same population size, population growth, depreciation rate and production function. But Cocoloco has a larger capital stock than Sambapati. Output in both countries is produced according to the following constant-returns-toscale production function that lies at the heart of the standard Solow growth model: Y8) = 35[K(t)]9-5 [Lands where Y(t) is the aggregate output in year t, K(t) is the capital in year t, and L0?) is the labor in year t. Assume that the savings rate is 18% (s = 0.18), the population grows at a rate of 0.9 % per year (n = 0.009), and capital depreciates at a rate of 1.6% per year ((1 = 0.016). (a) [3 pts] Express the production function in per capita terms (i.e., derive an expression for y as a function of k, where y indicates outputtolabor ratio, and k is the capitaltolabor ratio). Just type the nal expression. (nonmath format is enough, for example a={b"lf3)*c"(2f3)) (b) [4 pts ]What are the steady state levels of capital per worker (kss) and income per workeyss)? (use two decimals for display) Assume that in the initial year (t=0), the capital stock per worker in Cocoloco is 450 (K(0) = 450) and the capital stock per worker in Sambapati is 150 (KM) =150). In addition, assume that the population is 1 for both Cocoloco and Sambapati (12(0):!) (c) [4 pts] For Cocoloco, what are the total income Y(0), total saving 8(0) at the end of year 0? (use two decimals for display) Y(0) (d) [4 pts] For Cocoloco, what are the capital per worker k(l), income per capita y(1) in year 1? (Use Mo decimal spaces for display) y(1) (e) [4 pts] On one graph plot the income per capita levels for the two countries over 300 years under N0 exogenous technological change. Please copy this graph into the Excel worksheet titled \"Figure 3C\" in the Excel template. (f) [4 pts] 011 a separate graph, plot the income per-capita growth rates over 300 years for both countries. Please copy this graph into the Excel worksheet titled \"Figure 3D\" in the Excel template
Step by Step Solution
There are 3 Steps involved in it

Get step-by-step solutions from verified subject matter experts