

Question: 4) A Morgan Stanley analyst produced the financial forecasts provided in the Snap Supplemental Workbook shortly after the offering. The analyst assumed a WACC of
4) A Morgan Stanley analyst produced the financial forecasts provided in the Snap Supplemental Workbook shortly after the offering. The analyst assumed a WACC of 9.7% and 1,404 shares outstanding. Under these assumptions, what would be the discounted cash flow (DCF)estimate of Snap stocks fair market value on a per share basis?
a. How sensitive is this estimate of Snaps stock price to assumptions about growth and WACC?654
b. Do the assumptions and forecasts appear reasonable? What data would you use to assess that?
c. Analyze Snaps DCF value under various alternative assumptions of your own.
i. What important changes would you make to the forecasts provided in the Snap Supplemental Workbook, if any?
ii. What discount rate would you recommend using in this DCF analysis? Assume a long-term government bond rate of 3.16%.
iii. How, in particular, would you deal with the uncertainty associated with Snaps future growth?
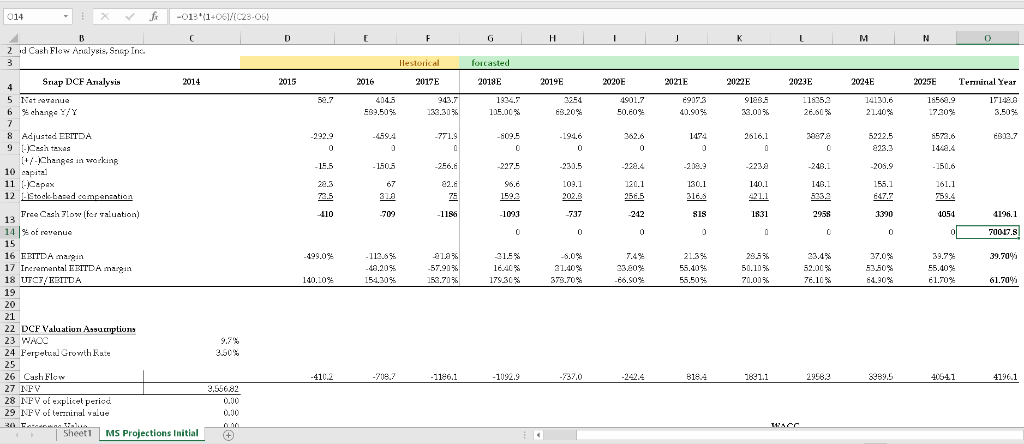
014 2 d Cash Flew Ailysis, SriapIn- asted Stiap DCF Analysis 2014 2015 2016 2017E 2019E 2021E 2022E 2024E Temunial Year 4015 ES 3.50% 1934.7 3354 60.20% 4901.7 50.60% 91 ,5 16353 14130.6 15569.9 '720% 171420 6 %change Y/Y 115-01 % 33.01% 26.50 % 21.40% 8 Adjustsd EEITDA 1474 2616.1 1442.4 15.5 227.5 230.5 208.9 246.1 205.9 11 - 2.6 96.6 130.1 46.1 Free Cash low[er aluation) 14 1% of revenue 410 i i86 1093 81S 1831 1390 4196.1 P0015.8 .3LE% 16.41 % 179SC % -5.0% 31.40% 33,7% 55.40% 499.0% 112.6% 48.20% 154.30% 7.4% 33.50% 66,50% 21.3% 23.4 % 52.OC % 761% 39.70% 17 Ireramantal EBITDA:N 53,50% 57.90 153.71% 50.1 70,0)% 140.0% 55.50% 61.70% 22 DCF Valuatiun Assucrption 24 Feeual Growth Rate 26 Cah Flew 97% 410.2 1186.1 1032.9 818 1811 383.5 40941 27 NFV 3,55682 28 NVof explicet pericd 29 INPVof ternal value 0.00 Sheet MS Projections Initial 014 2 d Cash Flew Ailysis, SriapIn- asted Stiap DCF Analysis 2014 2015 2016 2017E 2019E 2021E 2022E 2024E Temunial Year 4015 ES 3.50% 1934.7 3354 60.20% 4901.7 50.60% 91 ,5 16353 14130.6 15569.9 '720% 171420 6 %change Y/Y 115-01 % 33.01% 26.50 % 21.40% 8 Adjustsd EEITDA 1474 2616.1 1442.4 15.5 227.5 230.5 208.9 246.1 205.9 11 - 2.6 96.6 130.1 46.1 Free Cash low[er aluation) 14 1% of revenue 410 i i86 1093 81S 1831 1390 4196.1 P0015.8 .3LE% 16.41 % 179SC % -5.0% 31.40% 33,7% 55.40% 499.0% 112.6% 48.20% 154.30% 7.4% 33.50% 66,50% 21.3% 23.4 % 52.OC % 761% 39.70% 17 Ireramantal EBITDA:N 53,50% 57.90 153.71% 50.1 70,0)% 140.0% 55.50% 61.70% 22 DCF Valuatiun Assucrption 24 Feeual Growth Rate 26 Cah Flew 97% 410.2 1186.1 1032.9 818 1811 383.5 40941 27 NFV 3,55682 28 NVof explicet pericd 29 INPVof ternal value 0.00 Sheet MS Projections Initial
Step by Step Solution
There are 3 Steps involved in it

Get step-by-step solutions from verified subject matter experts