

Question: 4 Are there differences between fast track and regular track students in regard to the average number of hours they (a) study, (b) work, and
4 Are there differences between fast track and regular track students in regard to the average number of hours they (a) study, (b) work, and (c) watch TV? Hours of study is quite skewed so compute an appropriate nonparametric statistic
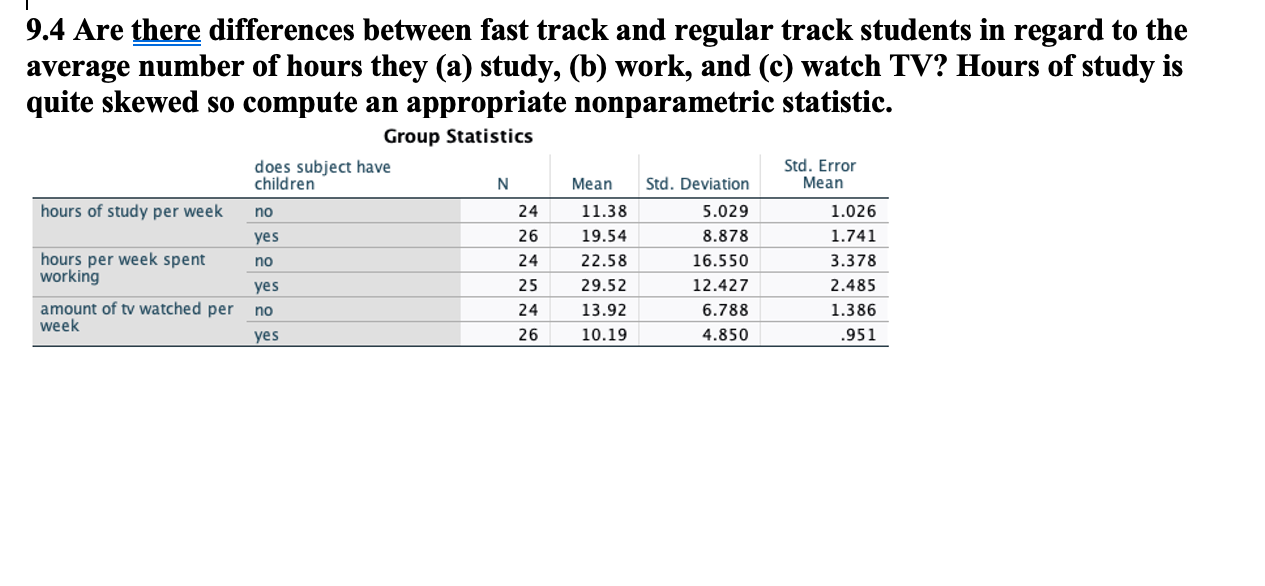
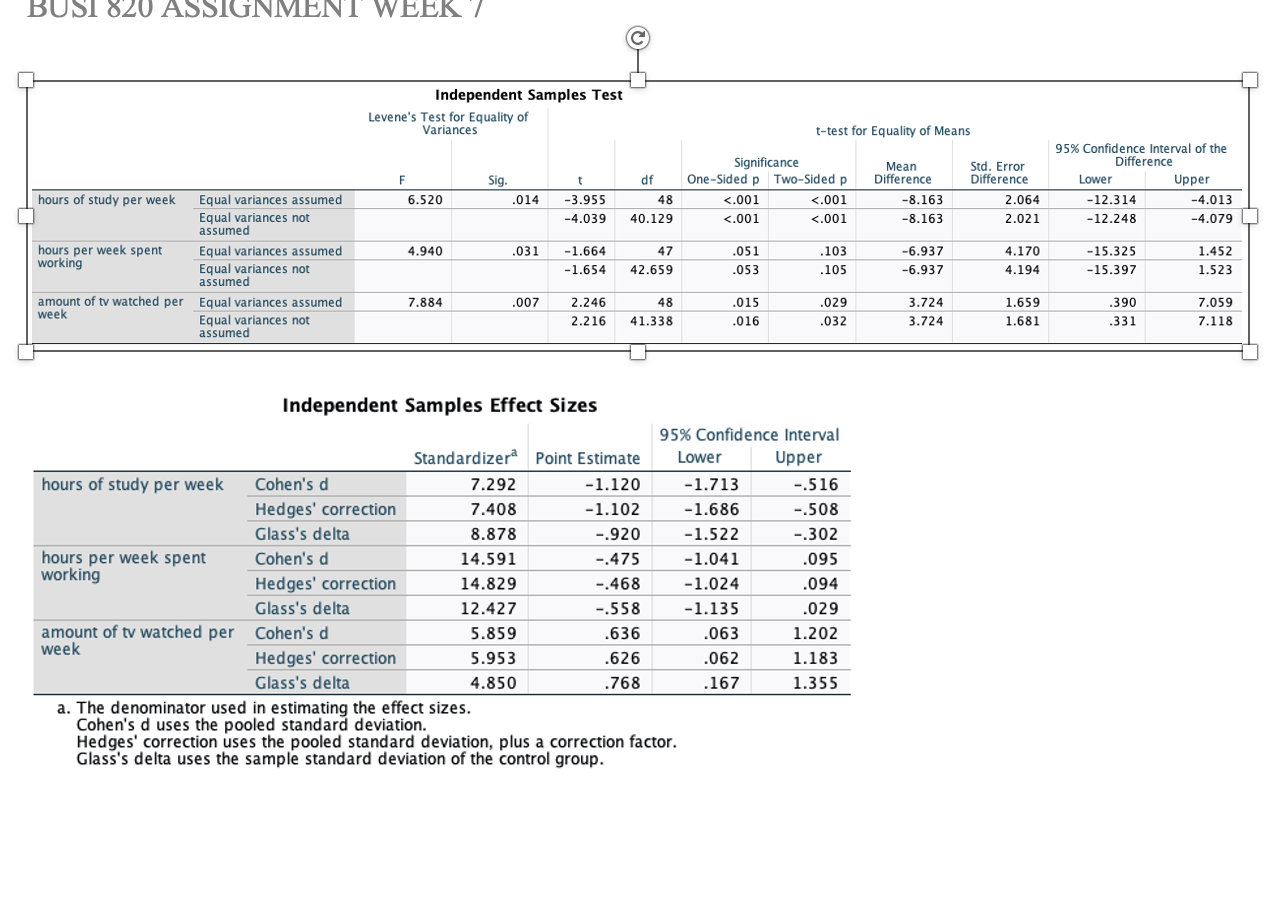
9.4 Are there differences between fast track and regular track students in regard to the average number of hours they (a) study, (b) work, and (c) watch TV? Hours of study is quite skewed so compute an appropriate nonparametric statistic. Group Statistics hours of study per week hours per week spent working amount of tv watched per week does subject have children no yes no yes no yes N 24 26 24 25 24 26 Mean 11.38 19.54 22.58 29.52 13.92 10.19 Std. Deviation 5.029 8.878 16.550 12.427 6.788 4.850 Std. Error Mean 1.026 1.741 3.378 2.485 1.386 .951 BUSI 820 ASSIGNMENT WEEK hours of study per week hours per week spent working Equal variances assumed Equal variances not assumed Equal variances assumed Equal variances not assumed amount of tv watched per Equal variances assumed week Equal variances not assumed hours of study per week hours per week spent working Levene's Test for Equality of Variances Cohen's d Hedges' correction Glass's delta Cohen's d Hedges' correction Glass's delta amount of tv watched per Cohen's d week Independent Samples Test F Hedges' correction Glass's delta 6.520 4.940 7.884 Sig. .014 .031 .007 Independent Samples Effect Sizes t -3.955 -4.039 -1.664 -1.654 7.292 7.408 8.878 14.591 14.829 12.427 5.859 5.953 4.850 2.246 2.216 df 48 40.129 47 42.659 48 41.338 Standardizer Point Estimate -1.120 -1.102 -.920 -.475 -.468 -.558 .636 .626 .768 Significance One-Sided p Two-Sided p <.001 lower a. the denominator used in estimating effect sizes. cohen d uses pooled standard deviation. hedges correction deviation plus a factor. glass delta sample of control group. .051 .053 .015 .016 t-test for equality means confidence interval upper .063 .062 .167 .103 .105 .029 .032 .095 .094 mean difference std. error .390 .331>
Step by Step Solution
There are 3 Steps involved in it
1 Expert Approved Answer
Step: 1 Unlock

Question Has Been Solved by an Expert!
Get step-by-step solutions from verified subject matter experts
Step: 2 Unlock
Step: 3 Unlock