

Question: 4. Below is actual price and dividend data for three companies for each of seven months. 579 368 0.7254 368 Security A Security B Security
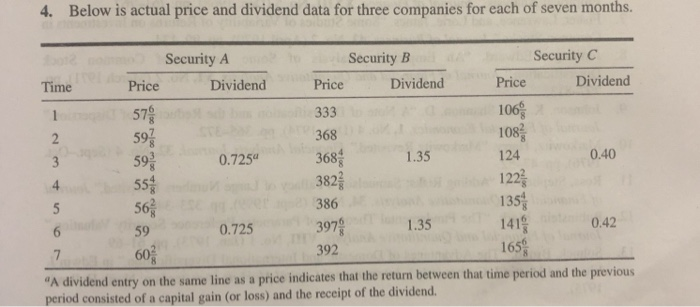
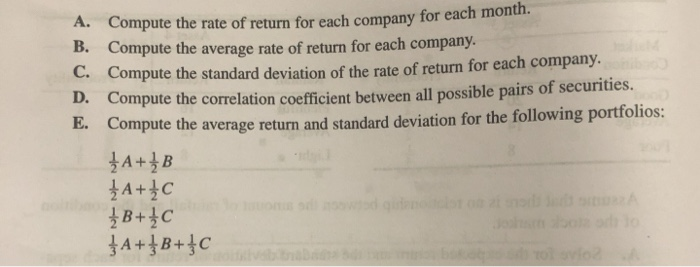
4. Below is actual price and dividend data for three companies for each of seven months. 579 368 0.7254 368 Security A Security B Security C Time Price Dividend Price Dividend Price Dividend 333 106 1087 1.35 124 0.40 55 382 386 135 0.725 397 1.35 1419 0.42 392 165 "A dividend entry on the same line as a price indicates that the return between that time period and the previous period consisted of a capital gain (or loss) and the receipt of the dividend. 122 59 602 A. Compute the rate of return for each company for each month. B. Compute the average rate of return for each company. C. Compute the standard deviation of the rate of return for each company. Compute the correlation coefficient between all possible pairs of securities. E. Compute the average return and standard deviation for the following portfolios: - A + 2 B {A+{c {B+{C A++B+fc oleh TOL Vio
Step by Step Solution
There are 3 Steps involved in it

Get step-by-step solutions from verified subject matter experts