

Question: 4. Create a table with a third column showing In y values. Then, create a scatterplot for (x, In y). Finally, use the scatterplot to
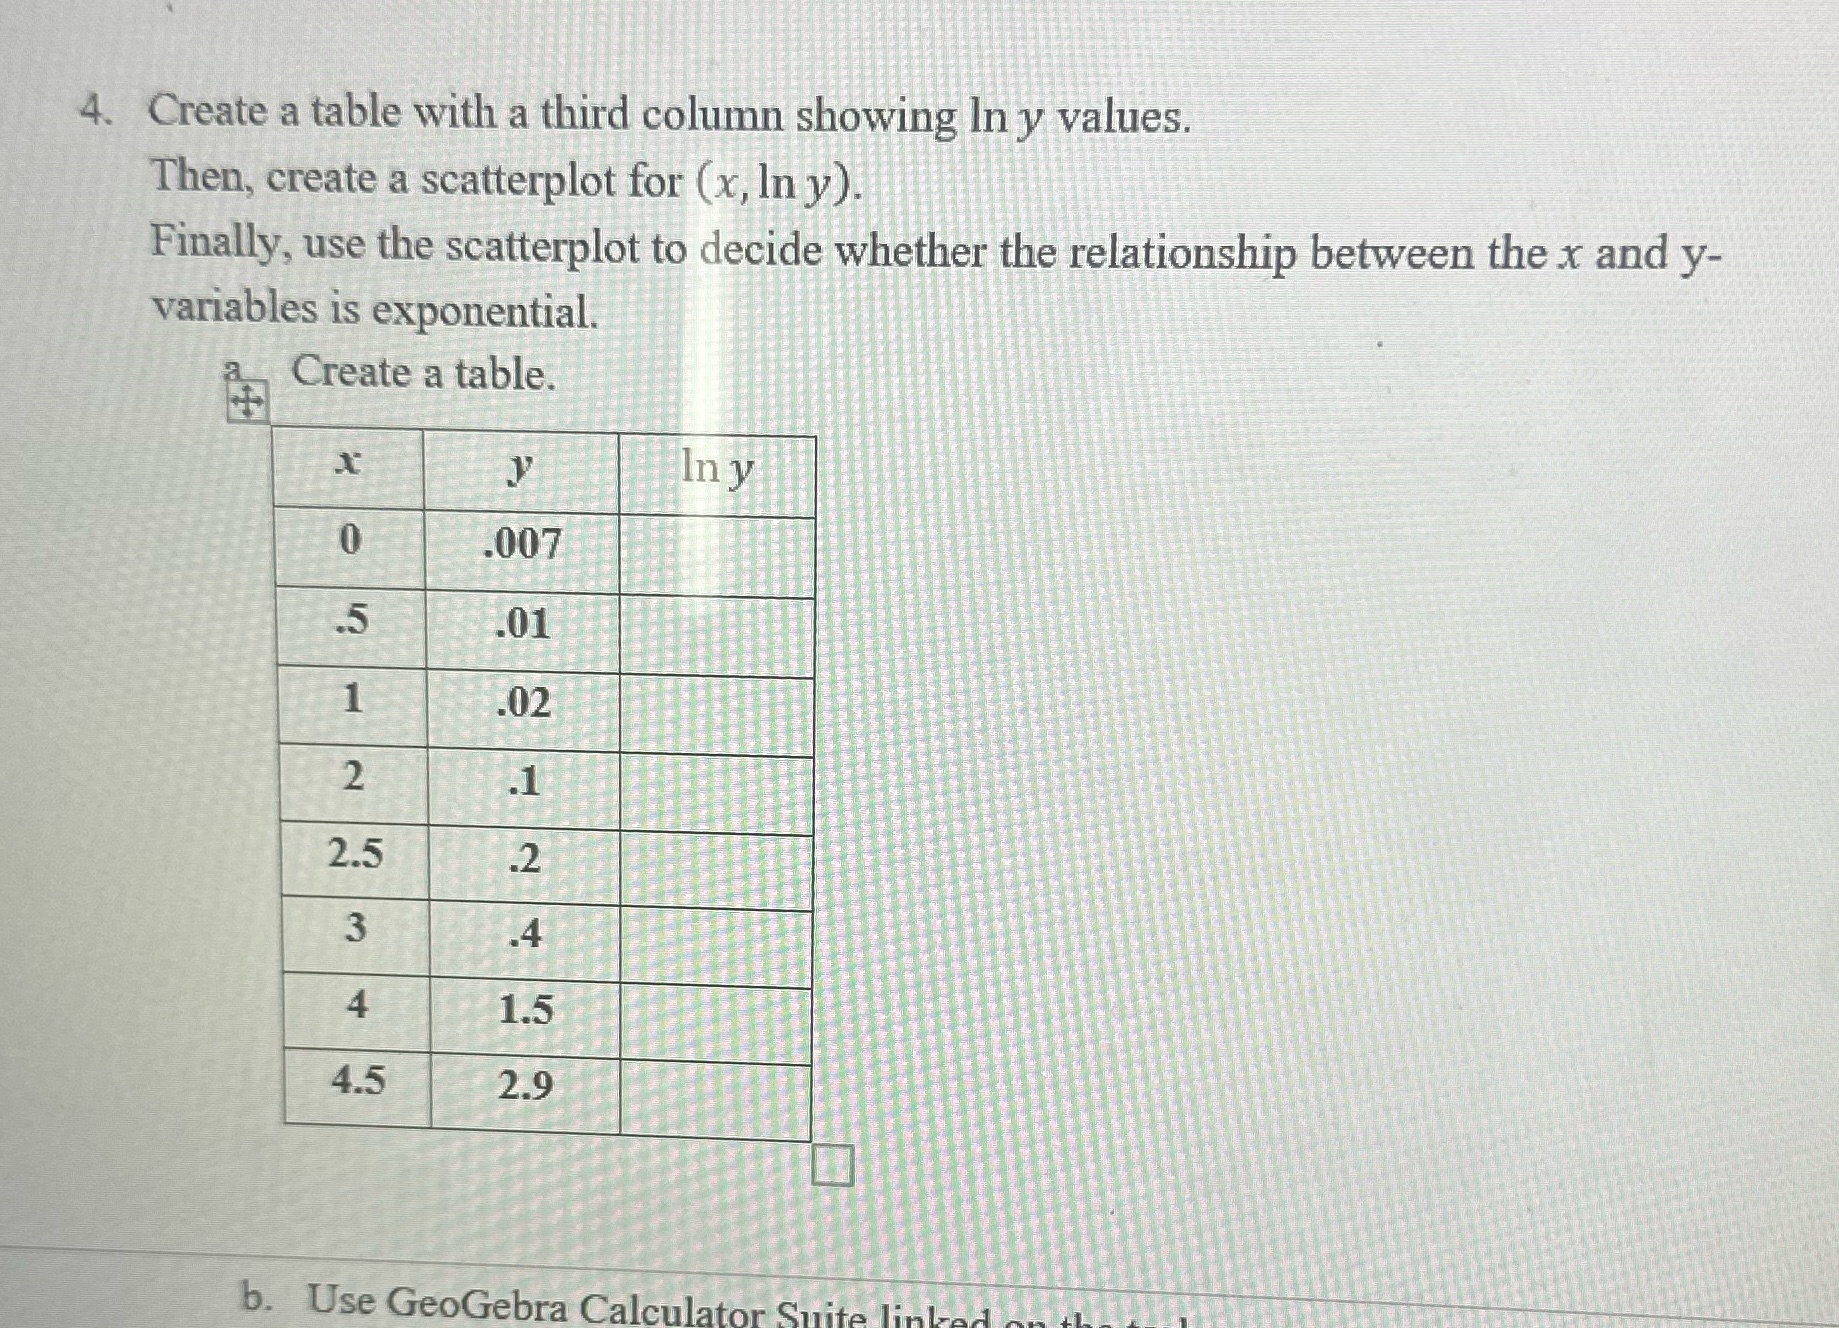
4. Create a table with a third column showing In y values. Then, create a scatterplot for (x, In y). Finally, use the scatterplot to decide whether the relationship between the x and y- variables is exponential. Create a table. In y 0 .007 .5 .01 02 2 .1 2.5 .2 3 .4 4 1.5 4.5 2.9 b. Use GeoGebra Calculator Suite linked
Step by Step Solution
There are 3 Steps involved in it
1 Expert Approved Answer
Step: 1 Unlock

Question Has Been Solved by an Expert!
Get step-by-step solutions from verified subject matter experts
Step: 2 Unlock
Step: 3 Unlock