

Question: 4. Expected dividends as a basis for stock values The fellowing graph.shows the value of a stock's divisends over time. The reckis current dridend is
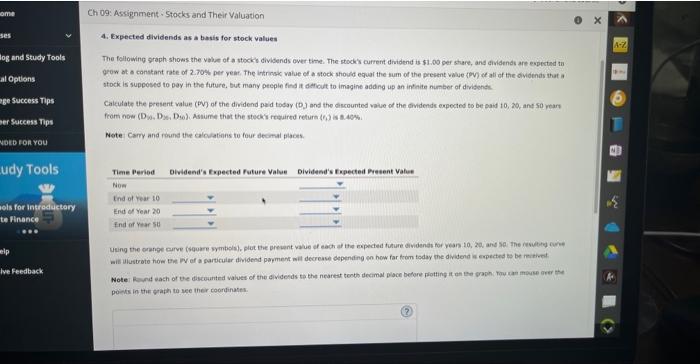
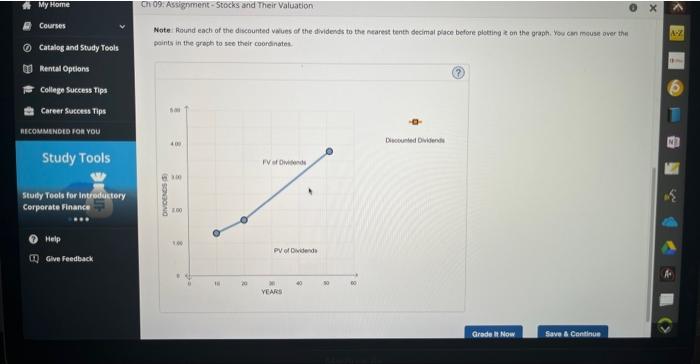
4. Expected dividends as a basis for stock values The fellowing graph.shows the value of a stock's divisends over time. The reckis current dridend is $1.00 cer share, and dividends are evperted ta grow at a constant rate of 2.70% per year. The irhresse walue of a stock should equar the sum of the present value \{DV of ati of the dividends that a atock is supposte to pay in the future, but many peepie find it dathout to imagine addng up an intaite numbor of dribends. Calculate the present value (PY) of the dividend paid tosay (D.) and the discounted value of the dividends expected to be paid to, 20 . ant so yeart Note Cary and rinand the calcuatinns te four deconal places. poivts in the prapt to see their coondinates. Note. Resurid each of the discounted Yaues of the dividends to the ncarest tenth decimal place before plething e on the graph. You can mouse over the fraints in the graph to sec their coorsinates
Step by Step Solution
There are 3 Steps involved in it

Get step-by-step solutions from verified subject matter experts