

Question: 4. Hypothesis Tests. For this question, use the data set cakids.dta in problem set 1 and analyze the variable Poverty Status 3. Test the null
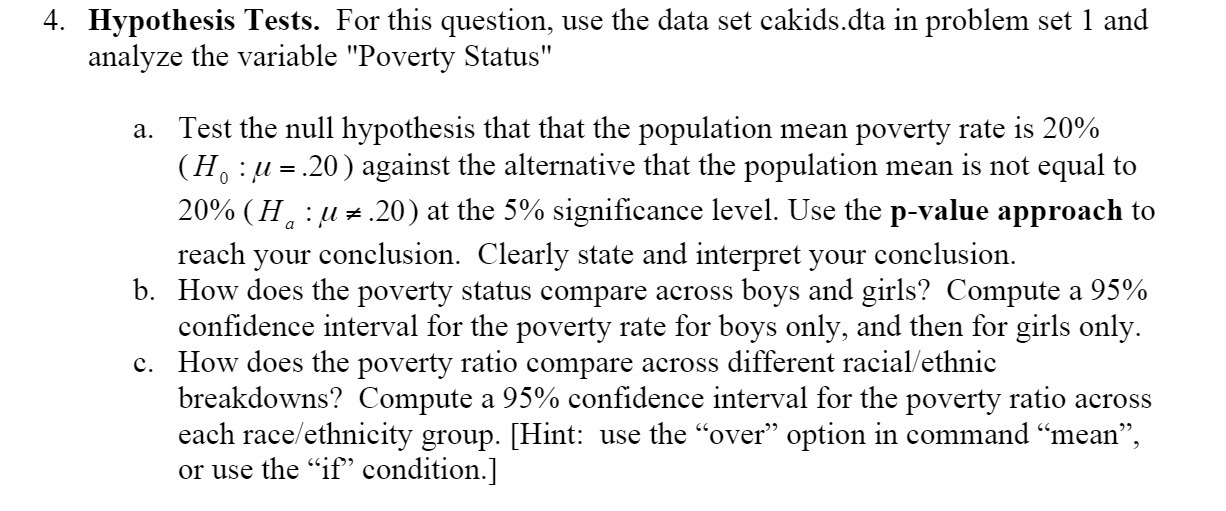
4. Hypothesis Tests. For this question, use the data set cakids.dta in problem set 1 and analyze the variable "Poverty Status" 3. Test the null hypothesis that that the population mean poverty rate is 20% (H 0 : y = .20) against the alternative that the population mean is not equal to 20% (H a : y a: .20) at the 5% signicance level. Use the pvalue approach to reach your conclusion. Clearly state and interpret your conclusion. b. How does the poverty status compare across boys and girls? Compute a 95% condence interval for the poverty rate for boys only, and then for girls only. c. How does the poverty ratio compare across different racial/ ethnic breakdowns? Compute a 95% condence interval for the poverty ratio across each race/ ethnicity group. [Hintz use the \"over\" option in command \"mean\
Step by Step Solution
There are 3 Steps involved in it

Get step-by-step solutions from verified subject matter experts