

Question: (4 points) Given the following data set, let x be the explanatory variable and y be the response variable. x 7 1 5 8 1
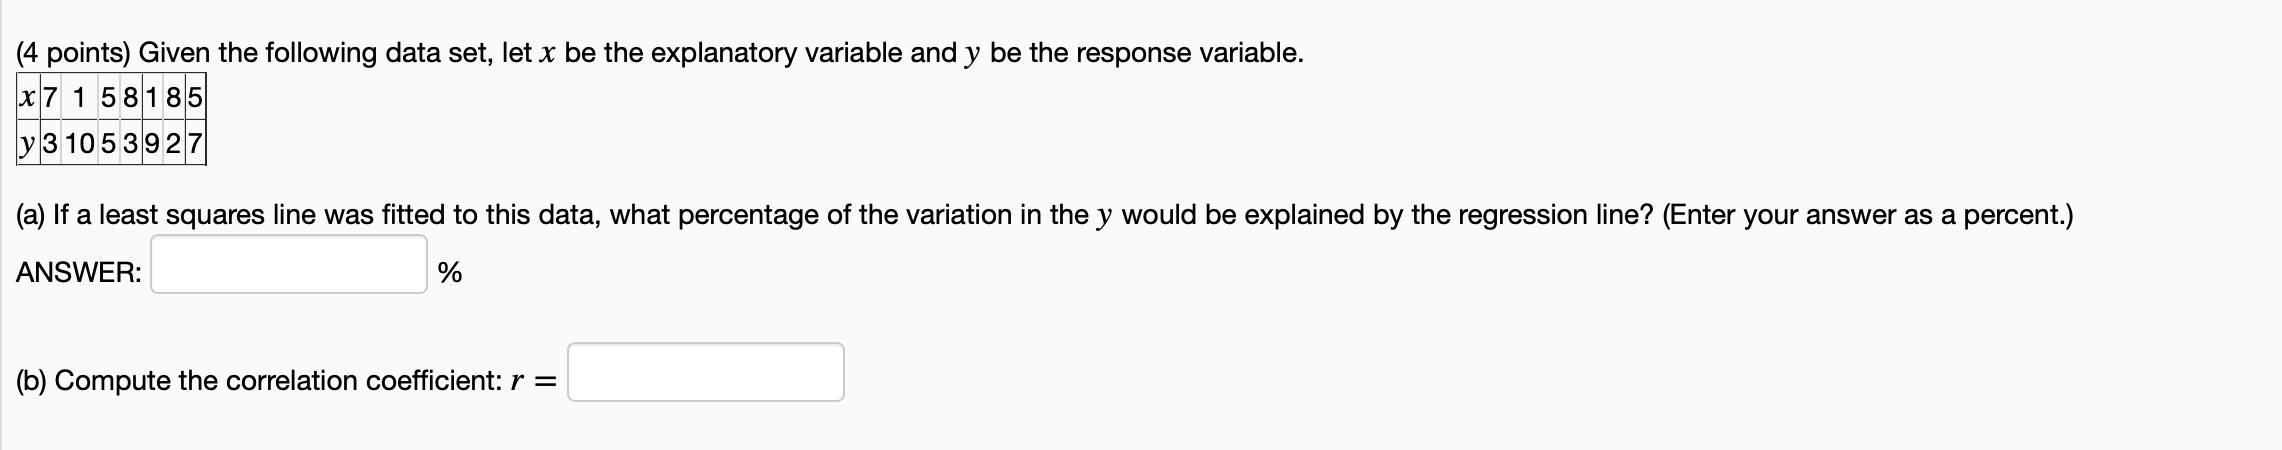
(4 points) Given the following data set, let x be the explanatory variable and y be the response variable. x 7 1 5 8 1 8 5 y 3 10 5 3 9 2 7 (a) If a least squares line was fitted to this data, what percentage of the variation in the y would be explained by the regression line? (Enter your answer as a percent.) ANSWER: % 0)) Compute the correlation coefficient: r =
Step by Step Solution
There are 3 Steps involved in it
1 Expert Approved Answer
Step: 1 Unlock

Question Has Been Solved by an Expert!
Get step-by-step solutions from verified subject matter experts
Step: 2 Unlock
Step: 3 Unlock