

Question: Given the following data set, let x be the explanatory variable and y be the response variable. 5 6 6 6 3 00 2 2
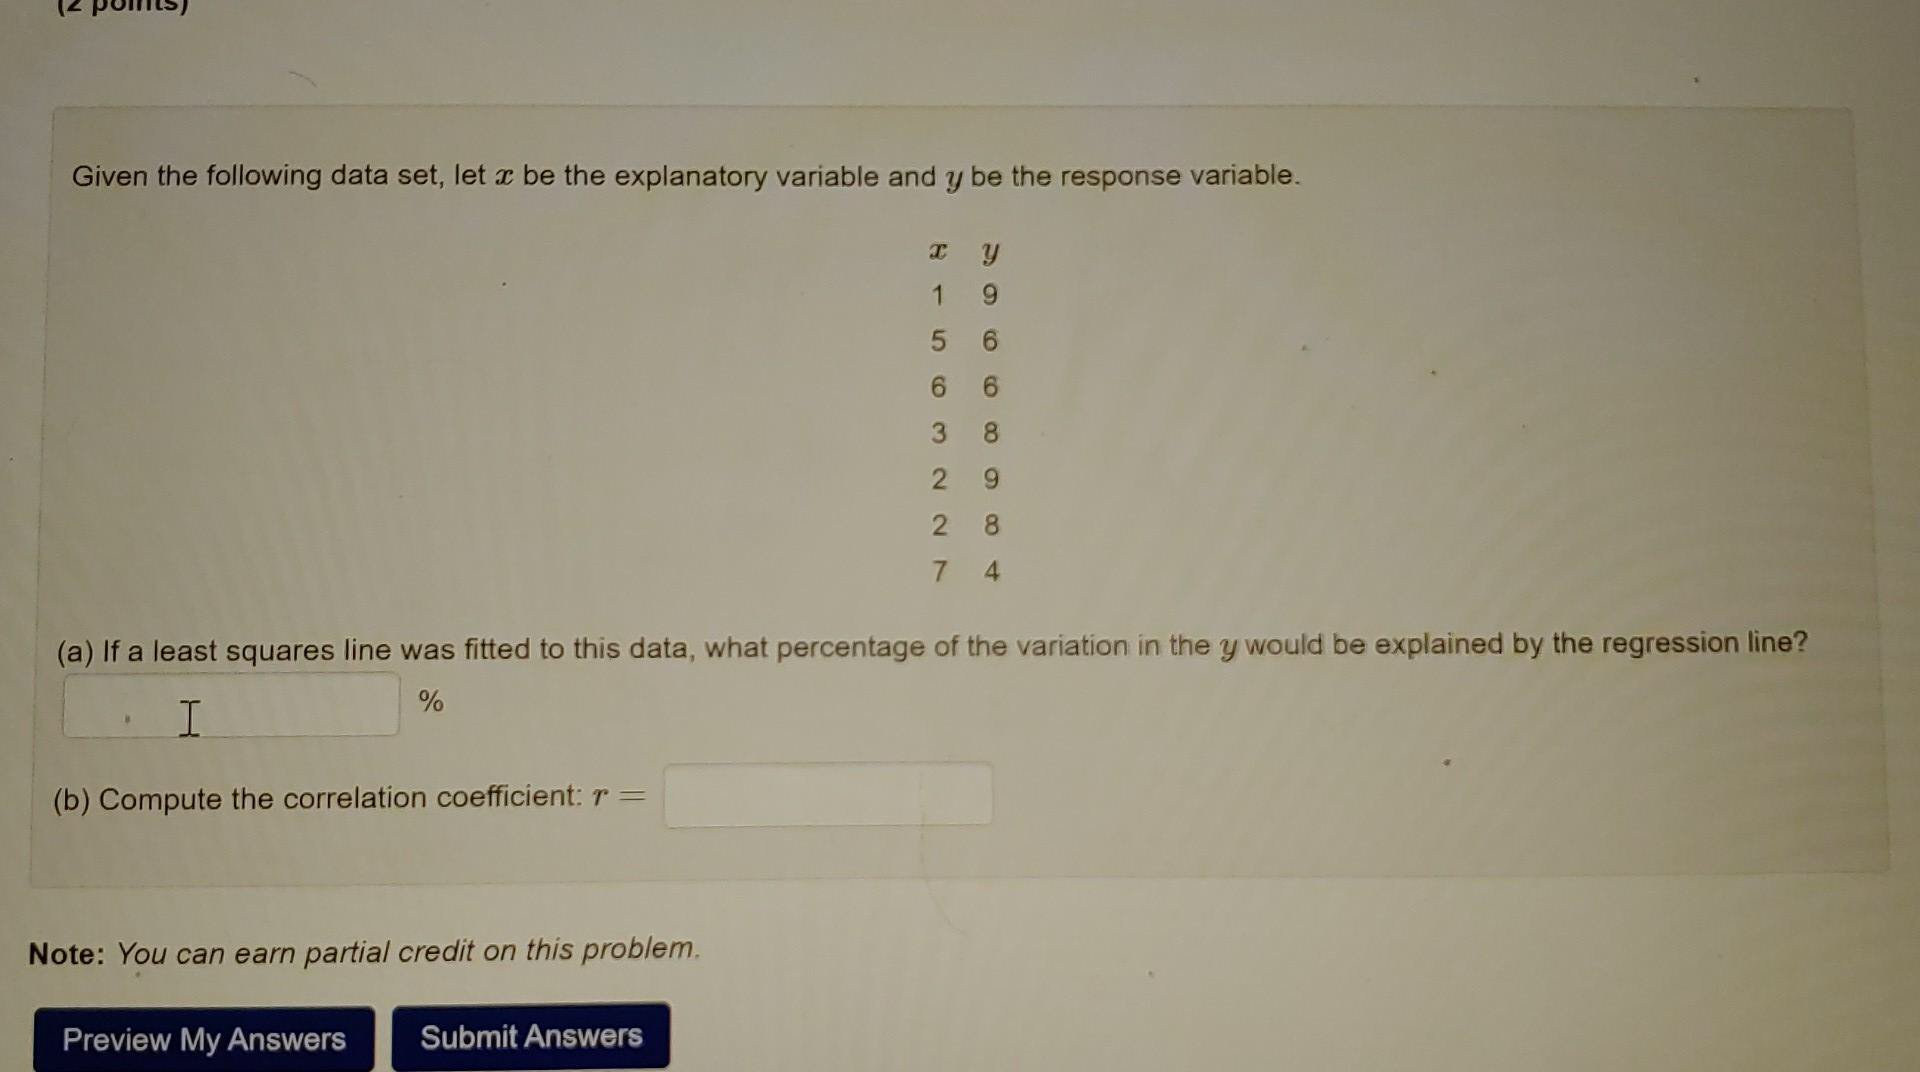
Given the following data set, let x be the explanatory variable and y be the response variable. 5 6 6 6 3 00 2 2 8 7 4 (a) If a least squares line was fitted to this data, what percentage of the variation in the y would be explained by the regression line? % I (b) Compute the correlation coefficient: r = Note: You can earn partial credit on this problem. Preview My Answers Submit Answers
Step by Step Solution
There are 3 Steps involved in it
1 Expert Approved Answer
Step: 1 Unlock

Question Has Been Solved by an Expert!
Get step-by-step solutions from verified subject matter experts
Step: 2 Unlock
Step: 3 Unlock