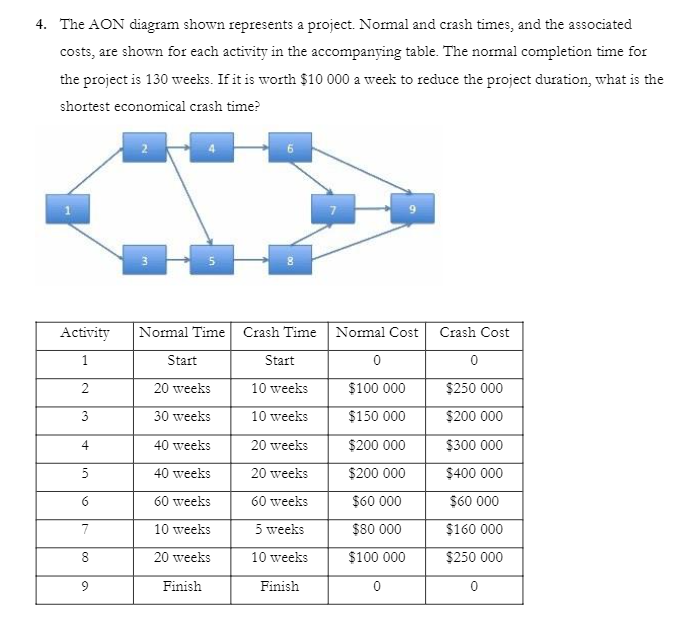
Question: 4. The AON diagram shown represents a project. Normal and crash times, and the associated costs, are shown for each activity in the accompanying table.

4. The AON diagram shown represents a project.

4. The AON diagram shown represents a project. Normal and crash times, and the associated costs, are shown for each activity in the accompanying table. The normal completion time for the project is 130 weeks. If it is worth $10 000 a week to reduce the project duration, what is the shortest economical crash time? 2 Normal Time Crash Time Normal Cost Crash Cost Activity 1 Start Start 0 0 2 20 weeks 10 weeks $100 000 $250 000 3 30 weeks 10 weeks $150 000 4 40 weeks 20 weeks $200 000 $200 000 5 40 weeks 20 weeks $200 000 $300 000 $400 000 $60 000 $160 000 $250 000 6 60 weeks 60 weeks $60 000 7 10 weeks 5 weeks $80 000 8 20 weeks 10 weeks $100 000 9 9 Finish Finish 0 0

Step by Step Solution

There are 3 Steps involved in it

1 Expert Approved Answer
Step: 1 Unlock blur-text-image
Question Has Been Solved by an Expert!

Get step-by-step solutions from verified subject matter experts

Step: 2 Unlock
Step: 3 Unlock

Students Have Also Explored These Related General Management Questions!