

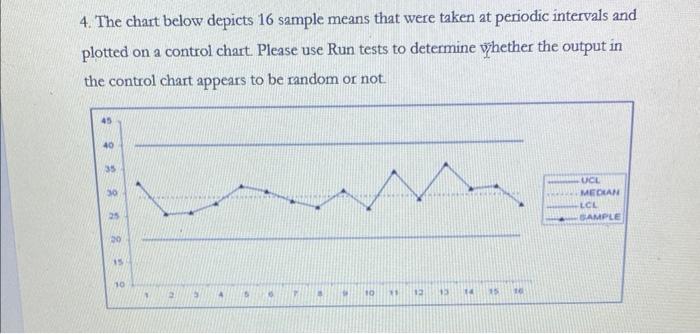
Question: 4. The chart below depicts 16 sample means that were taken at periodic intervals and plotted on a control chart. Please use Run tests to
Step by Step Solution
There are 3 Steps involved in it
1 Expert Approved Answer
Step: 1 Unlock

Question Has Been Solved by an Expert!
Get step-by-step solutions from verified subject matter experts
Step: 2 Unlock
Step: 3 Unlock