

Question: 4. The cotton prices are given for 12 months. Using this data do 4 month moving average and 4 month weighted moving average for the

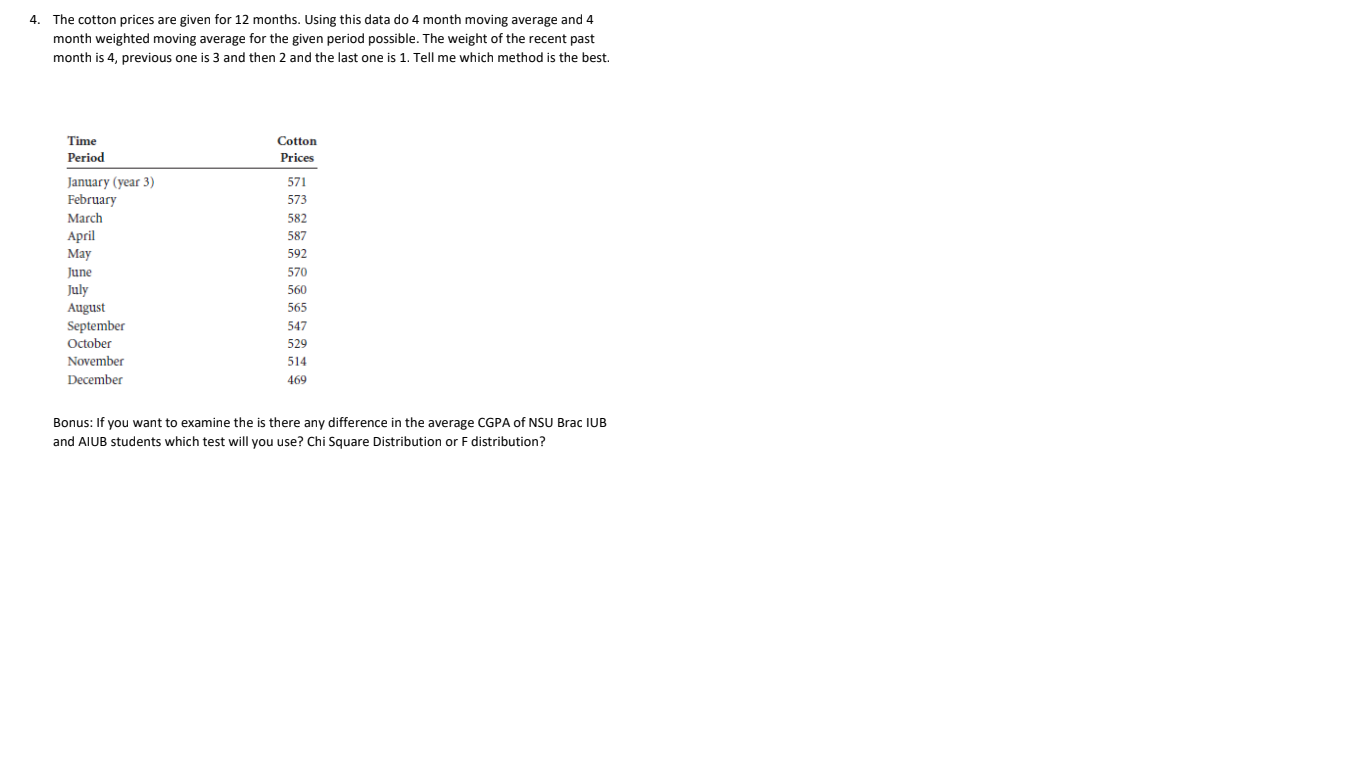
4. The cotton prices are given for 12 months. Using this data do 4 month moving average and 4 month weighted moving average for the given period possible. The weight of the recent past month is 4, previous one is 3 and then 2 and the last one is 1. Tell me which method is the best. Time Cotton Period Prices January (year 3) 571 February 573 March 582 April 587 May 592 June 570 July 560 August 565 September 547 October 529 November 514 December 469 Bonus: If you want to examine the is there any difference in the average CGPA of NSU Brac IUB and AlUB students which test will you use? Chi Square Distribution or F distribution
Step by Step Solution
There are 3 Steps involved in it

Get step-by-step solutions from verified subject matter experts