

Question: The data in the following table were obtained during a colorimetric determination of glucose in blood serum. Glucose Concentration, mM Absorbance, A 0.0 2.0 4.0
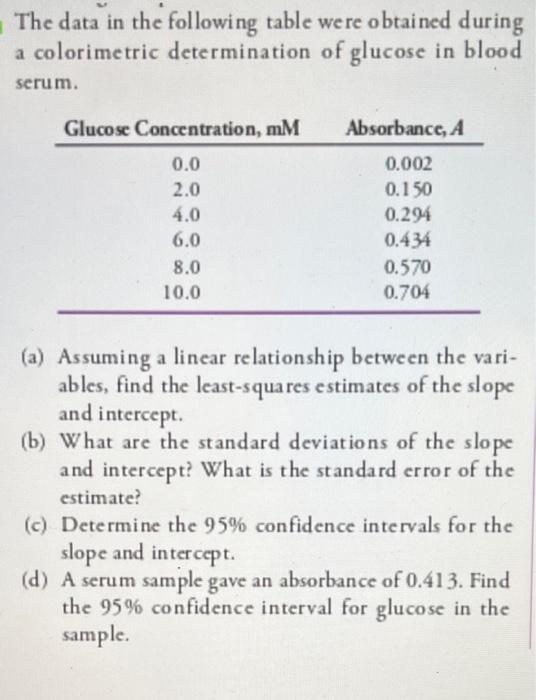
The data in the following table were obtained during a colorimetric determination of glucose in blood serum. Glucose Concentration, mM Absorbance, A 0.0 2.0 4.0 6.0 8.0 10.0 0.002 0.150 0.294 0.434 0.570 0.704 (a) Assuming a linear relationship between the vari- ables, find the least-squa res estimates of the slope and intercept (b) What are the standard deviations of the slope and intercept? What is the standard error of the estimate? (c) Determine the 95% confidence intervals for the slope and intercept. (d) A serum sample gave an absorbance of 0.413. Find the 95% confidence interval for glucose the sample
Step by Step Solution
There are 3 Steps involved in it
1 Expert Approved Answer
Step: 1 Unlock

Question Has Been Solved by an Expert!
Get step-by-step solutions from verified subject matter experts
Step: 2 Unlock
Step: 3 Unlock