

Question: 4. The graph of a function g is shown on the xy-plane on the interval (-7,7]. a. A table of selected values is given
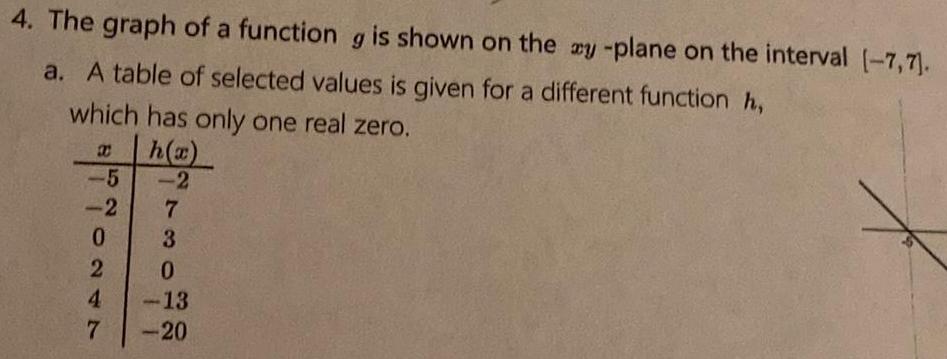
4. The graph of a function g is shown on the xy-plane on the interval (-7,7]. a. A table of selected values is given for a different function h, which has only one real zero. B h(x) -5 -2 -2 7 0 3 2 0 4 -13 7 -20
Step by Step Solution
There are 3 Steps involved in it
1 Expert Approved Answer
Step: 1 Unlock

Question Has Been Solved by an Expert!
Get step-by-step solutions from verified subject matter experts
Step: 2 Unlock
Step: 3 Unlock