

Question: 4. The scatter plot below shows the average traffic volume and average vehicle speed on a certain freeway for 50 days in 1999. Average Vehicle
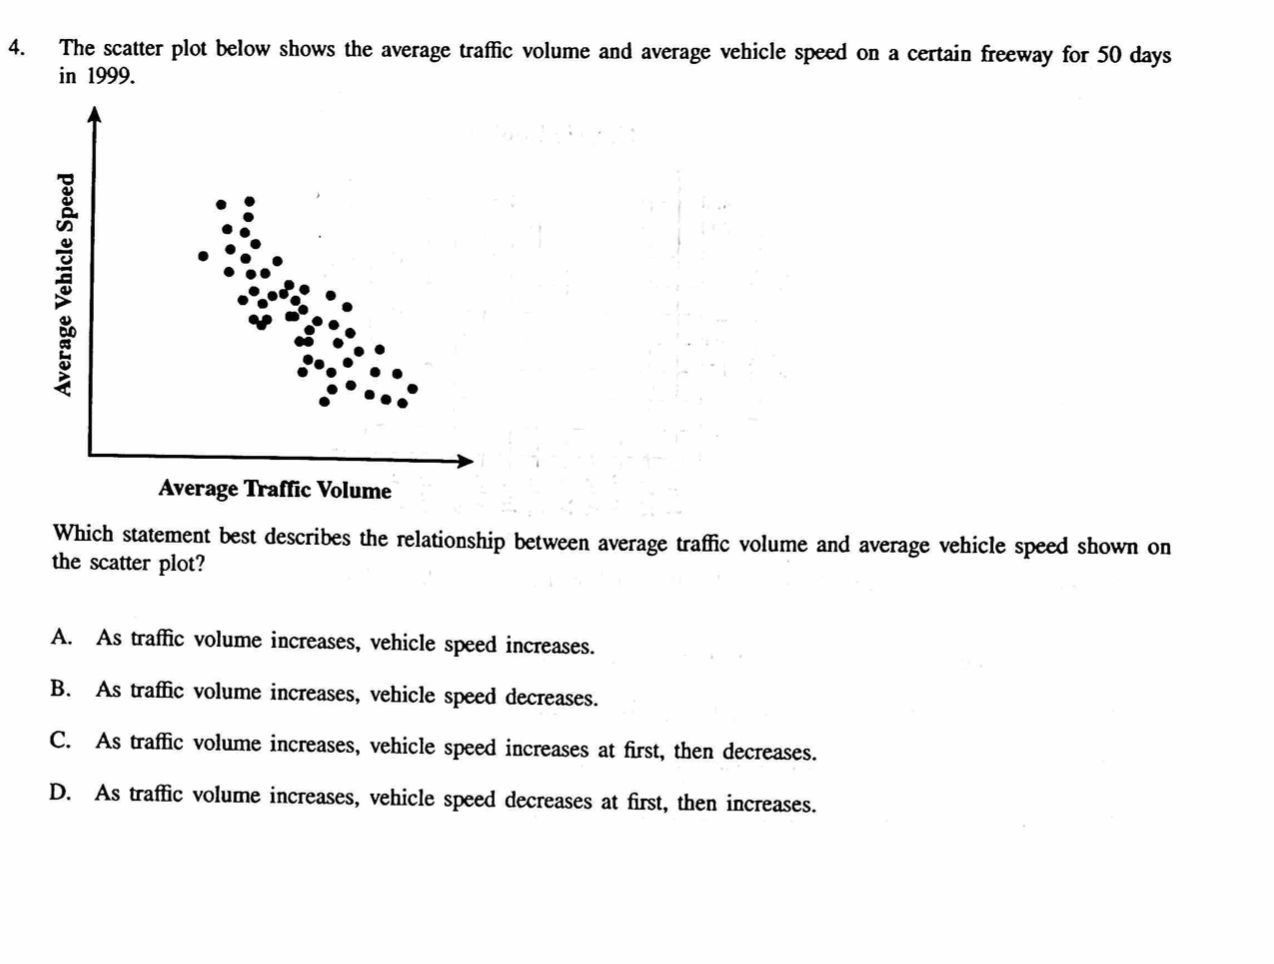
4. The scatter plot below shows the average traffic volume and average vehicle speed on a certain freeway for 50 days in 1999. Average Vehicle Speed Average Traffic Volume Which statement best describes the relationship between average traffic volume and average vehicle speed shown on the scatter plot? A. As traffic volume increases, vehicle speed increases. B. As traffic volume increases, vehicle speed decreases. C. As traffic volume increases, vehicle speed increases at first, then decreases. D. As traffic volume increases, vehicle speed decreases at first, then increases
Step by Step Solution
There are 3 Steps involved in it
1 Expert Approved Answer
Step: 1 Unlock

Question Has Been Solved by an Expert!
Get step-by-step solutions from verified subject matter experts
Step: 2 Unlock
Step: 3 Unlock