

Question: Help 1. The scatter plot below shows the average traffic 2. Ma. Ochoa recorded the age and shoe size of each volume and average vehicle
Help
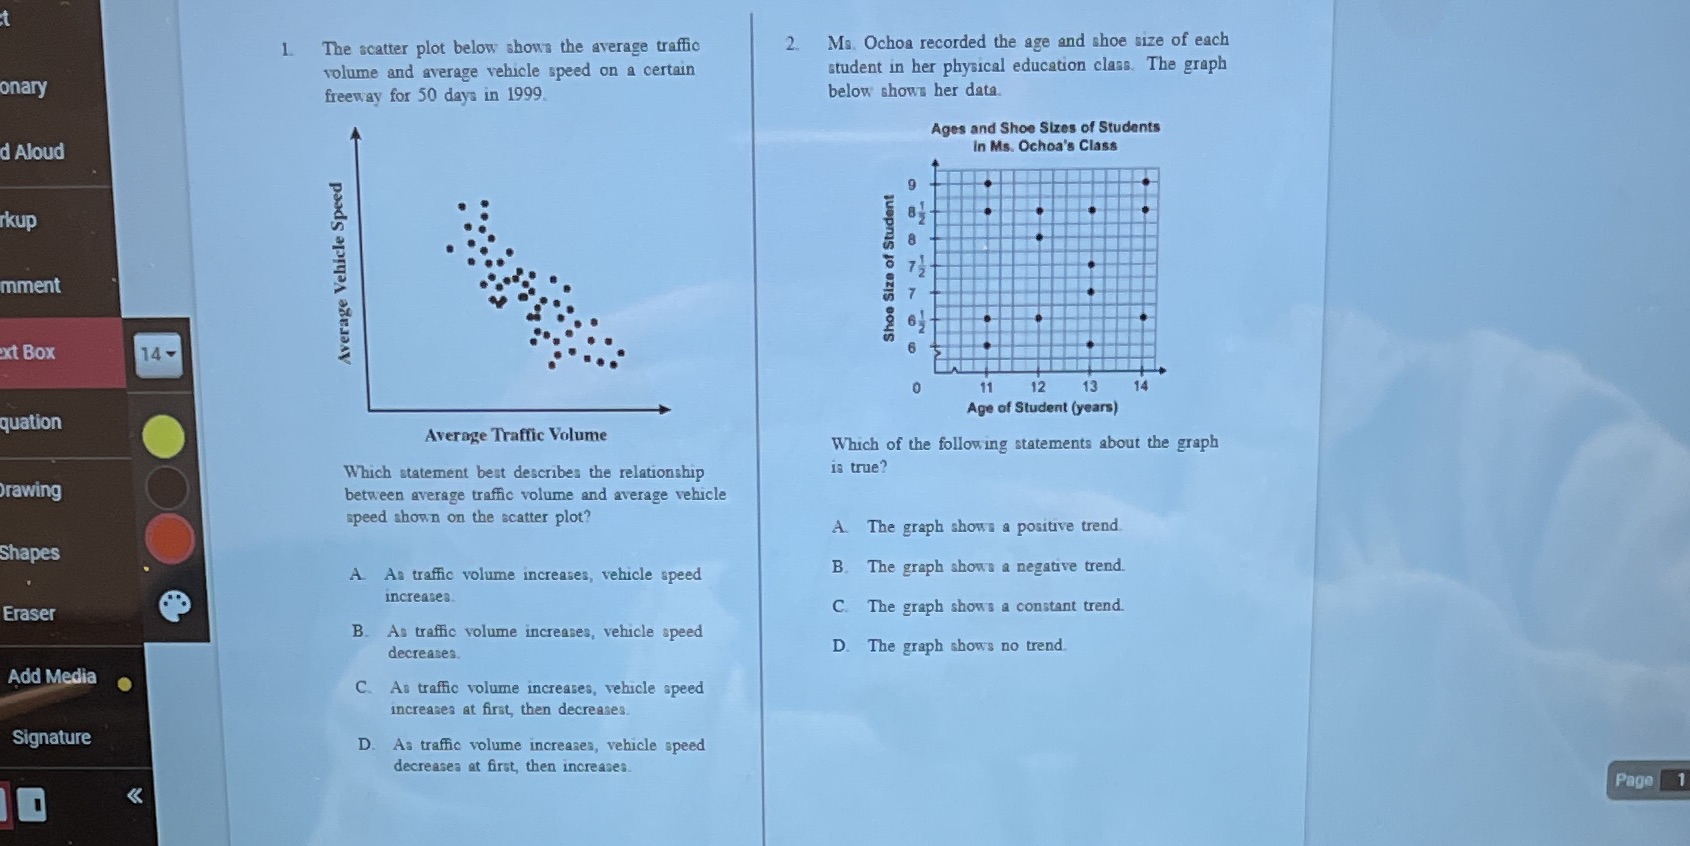
1. The scatter plot below shows the average traffic 2. Ma. Ochoa recorded the age and shoe size of each volume and average vehicle speed on a certain student in her physical education class. The graph onary freeway for 50 days in 1999. below shows her data. Ages and Shoe Sizes of Students d Aloud In Ms. Ochoa's Class kup Shoe Size of Student Average Vehicle Speed mment xt Box 14- 11 12 13 14 Age of Student (years) quation Average Traffic Volume Which of the following statements about the graph Which statement best describes the relationship is true? Drawing between average traffic volume and average vehicle speed shown on the scatter plot? A. The graph shows a positive trend shapes A As traffic volume increases, vehicle speed B. The graph shows a negative trend. increases. Eraser C. The graph shows a constant trend. B. As traffic volume increases, vehicle speed decreases. D. The graph shows no trend. Add Media C. As traffic volume increases, vehicle speed increases at first, then decreases. Signature D. As traffic volume increases, vehicle speed decreasea at first, then increases. Page 1
Step by Step Solution
There are 3 Steps involved in it

Get step-by-step solutions from verified subject matter experts