

Question: Answer the questions. The scatter plot below shows the average traffic volume and average vehicle speed on a certain freeway for 50 days in 1999,
Answer the questions.
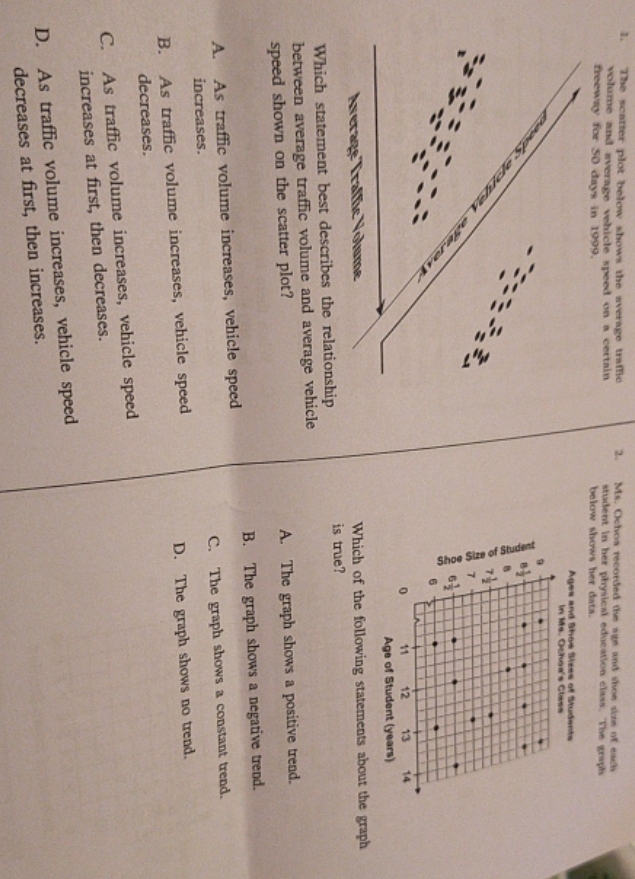
The scatter plot below shows the average traffic volume and average vehicle speed on a certain freeway for 50 days in 1999, Me. Ochoa recorded the sun and shon the of each shalent in her physical education class. The graph below shows her data. Ages and Shee Vres of Students In Ma. Other's Class quaprys jo azis boys 13 Age of Student (years) Average Traffic Volume Which of the following statements about the graph Which statement best describes the relationship is true? between average traffic volume and average vehicle speed shown on the scatter plot? A. The graph shows a positive trend. As traffic volume increases, vehicle speed B. The graph shows a negative trend. increases. C. The graph shows a constant trend. B. As traffic volume increases, vehicle speed D. The graph shows no trend. decreases. C. As traffic volume increases, vehicle speed increases at first, then decreases. D. As traffic volume increases, vehicle speed decreases at first, then increases
Step by Step Solution
There are 3 Steps involved in it

Get step-by-step solutions from verified subject matter experts