

Question: 4. The scatterplot below shows the number of hours spent studying for a physics test and the corresponding test grade for 20 students. 100+
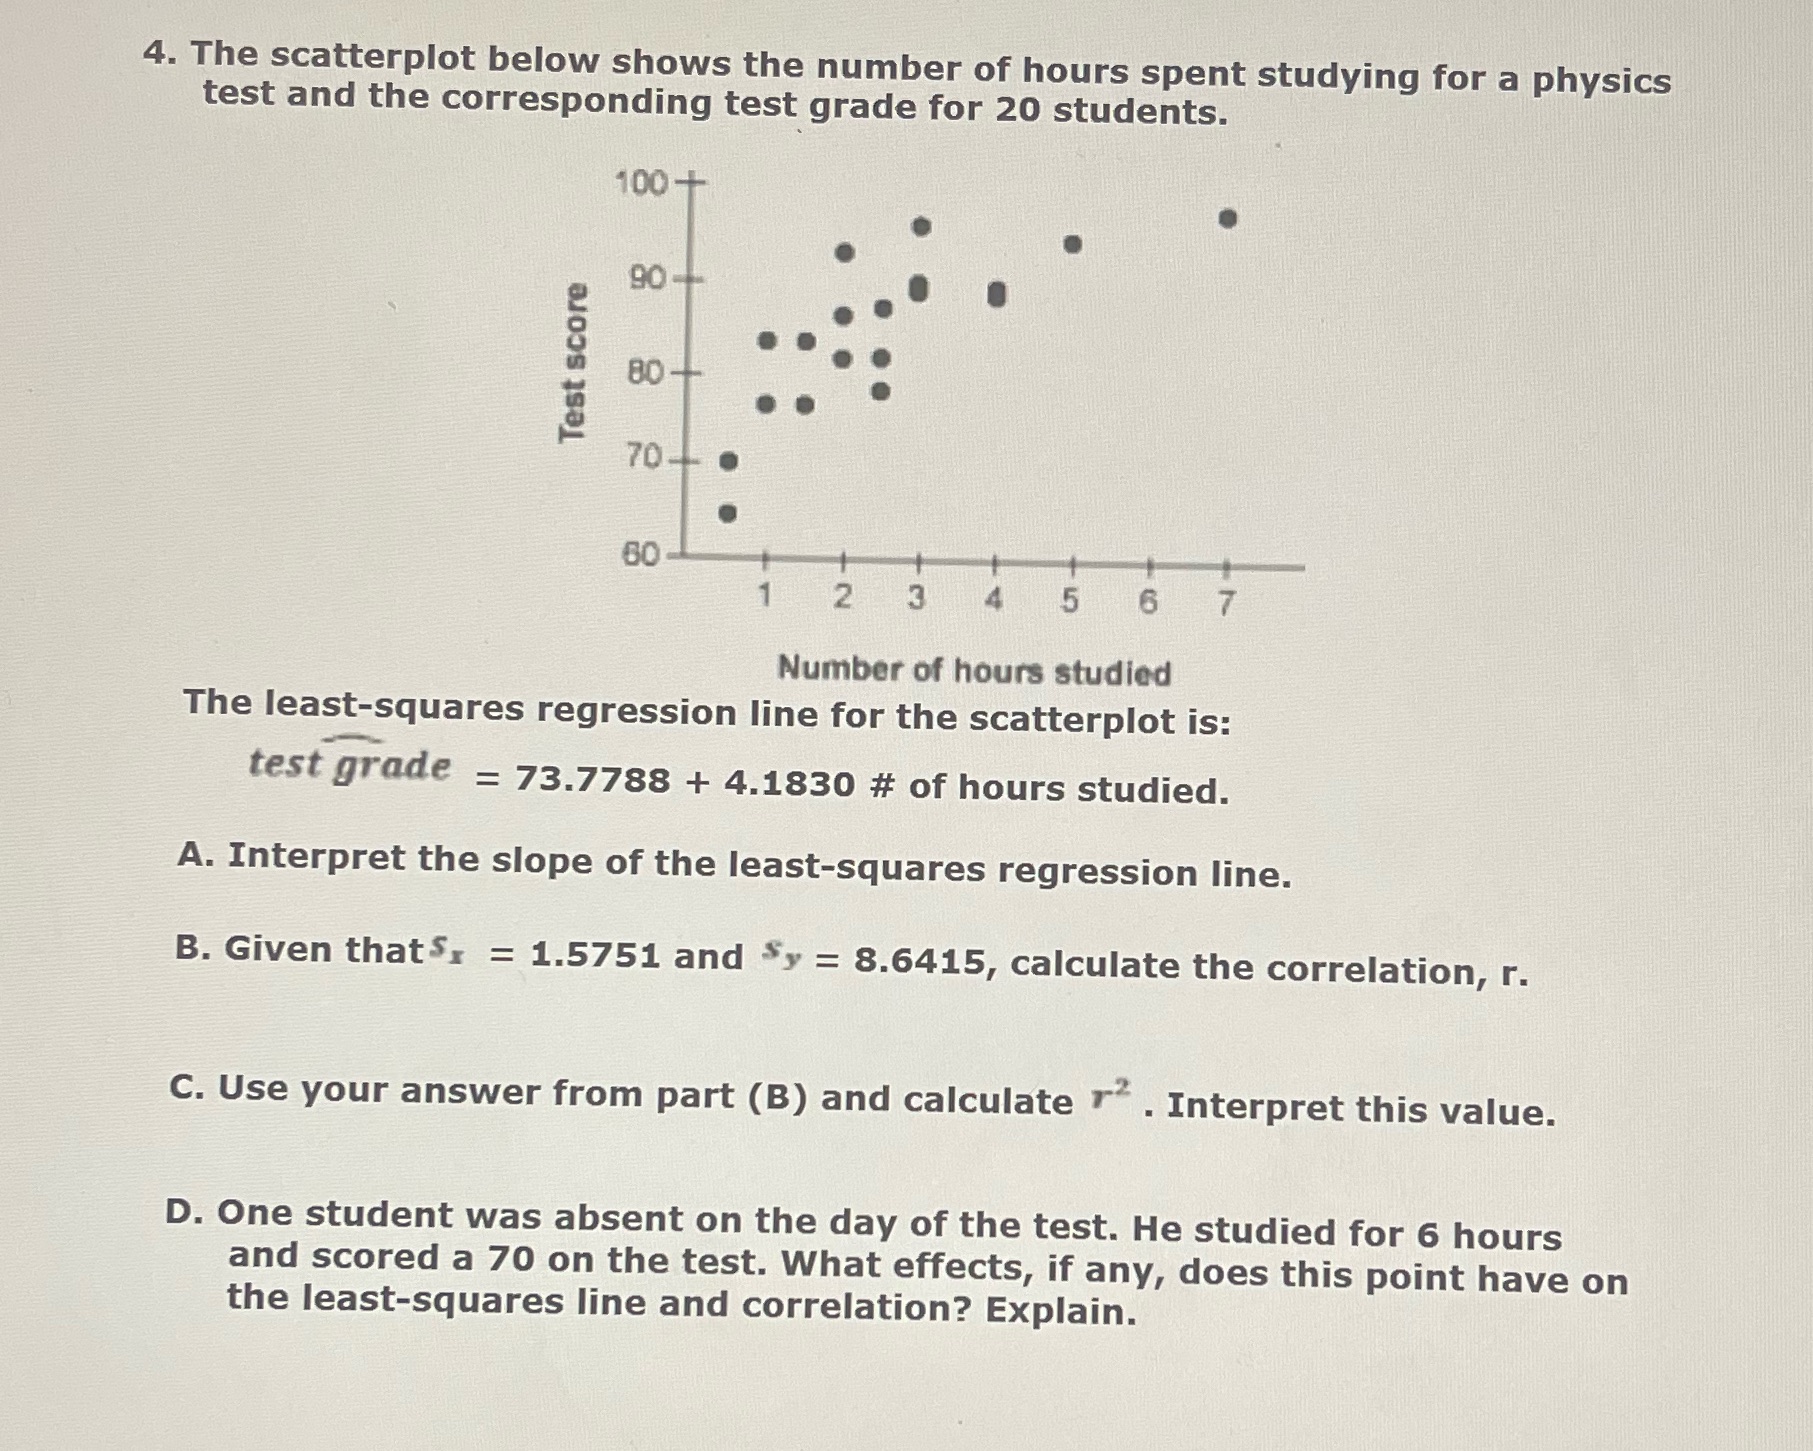
4. The scatterplot below shows the number of hours spent studying for a physics test and the corresponding test grade for 20 students. 100+ 90- Test score 80- 70- 00 60 1 2 3 4 5 6 7 Number of hours studied The least-squares regression line for the scatterplot is: test grade = 73.7788 + 4.1830 # of hours studied. A. Interpret the slope of the least-squares regression line. B. Given that $x = 1.5751 and $y = 8.6415, calculate the correlation, r. C. Use your answer from part (B) and calculate r. Interpret this value. D. One student was absent on the day of the test. He studied for 6 hours and scored a 70 on the test. What effects, if any, does this point have on the least-squares line and correlation? Explain.
Step by Step Solution
There are 3 Steps involved in it

Get step-by-step solutions from verified subject matter experts