

Question: 4. Use the following table containing the data from temperature measurements of sensors to determine a. The maximum b. The minimum c. The average temperature
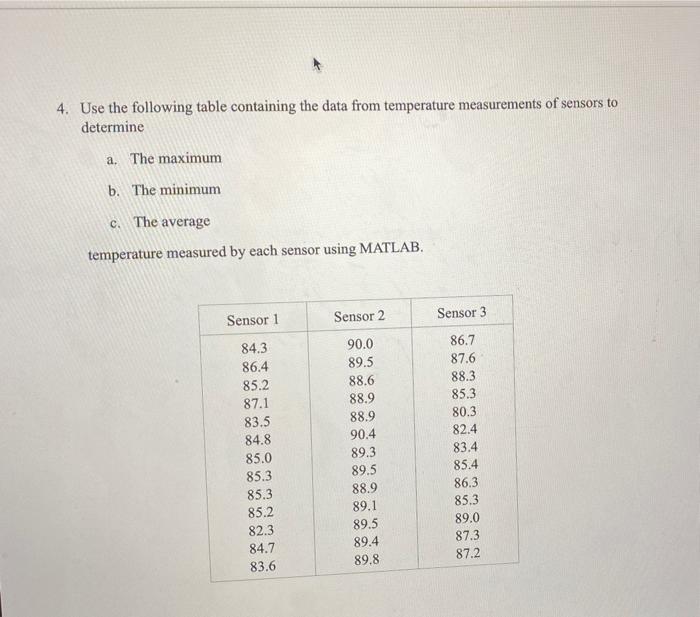
4. Use the following table containing the data from temperature measurements of sensors to determine a. The maximum b. The minimum c. The average temperature measured by each sensor using MATLAB. Sensor 1 Sensor 2 Sensor 3 84.3 86.4 85.2 87.1 83.5 84.8 85.0 85.3 85.3 85.2 82.3 84.7 83.6 90.0 89.5 88.6 88.9 88.9 90.4 89.3 89.5 88.9 89.1 89.5 89.4 89.8 86.7 87.6 88.3 85.3 80.3 82.4 83.4 85.4 86.3 85.3 89.0 87.3 87.2
Step by Step Solution
There are 3 Steps involved in it
1 Expert Approved Answer
Step: 1 Unlock

Question Has Been Solved by an Expert!
Get step-by-step solutions from verified subject matter experts
Step: 2 Unlock
Step: 3 Unlock