

Question: 4. Use the graph of the function to estimate the intervals on which the function is increasing or decreasing. (Enter your answers using interval notation.)


4.

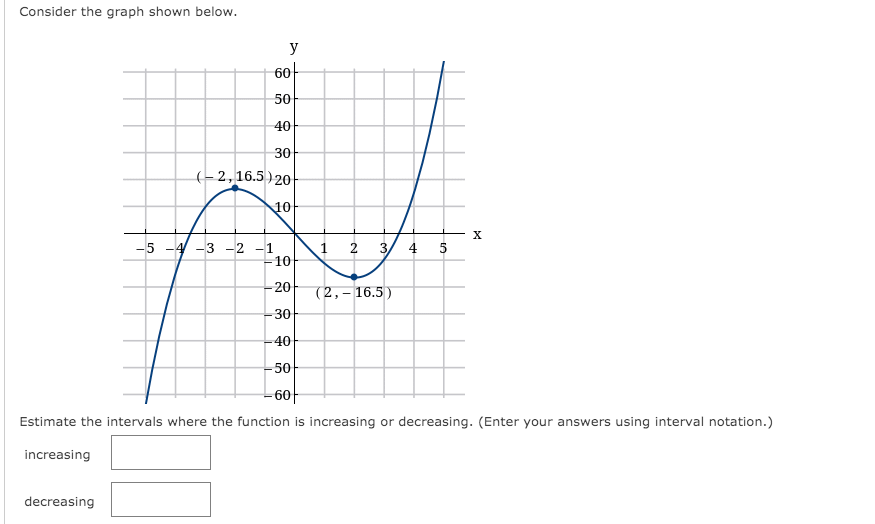


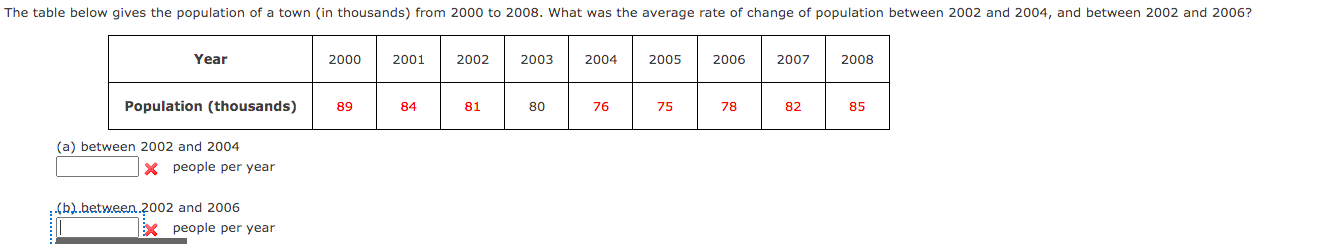

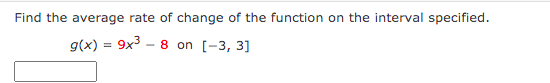
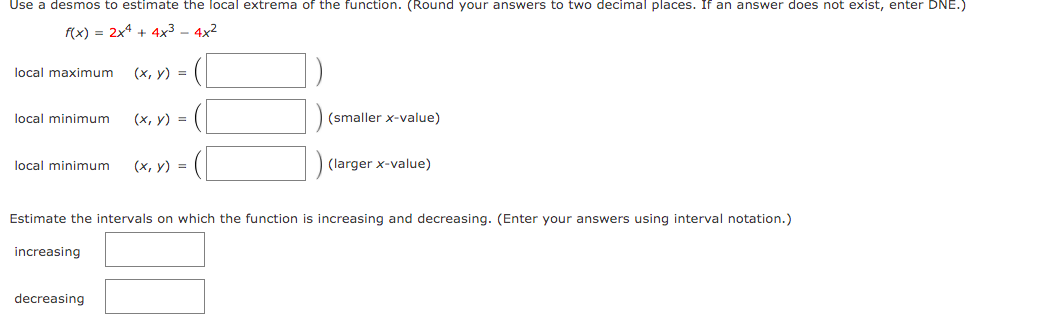


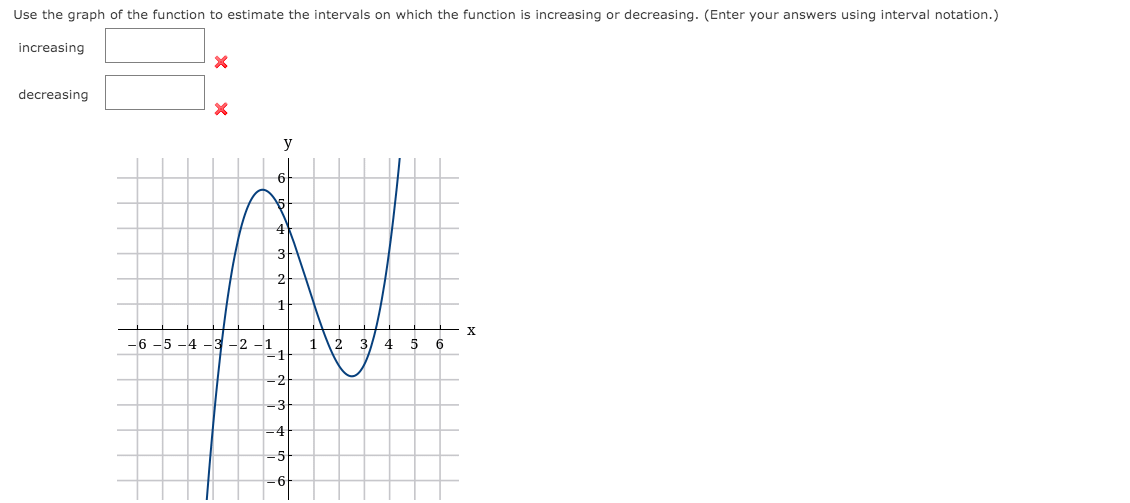
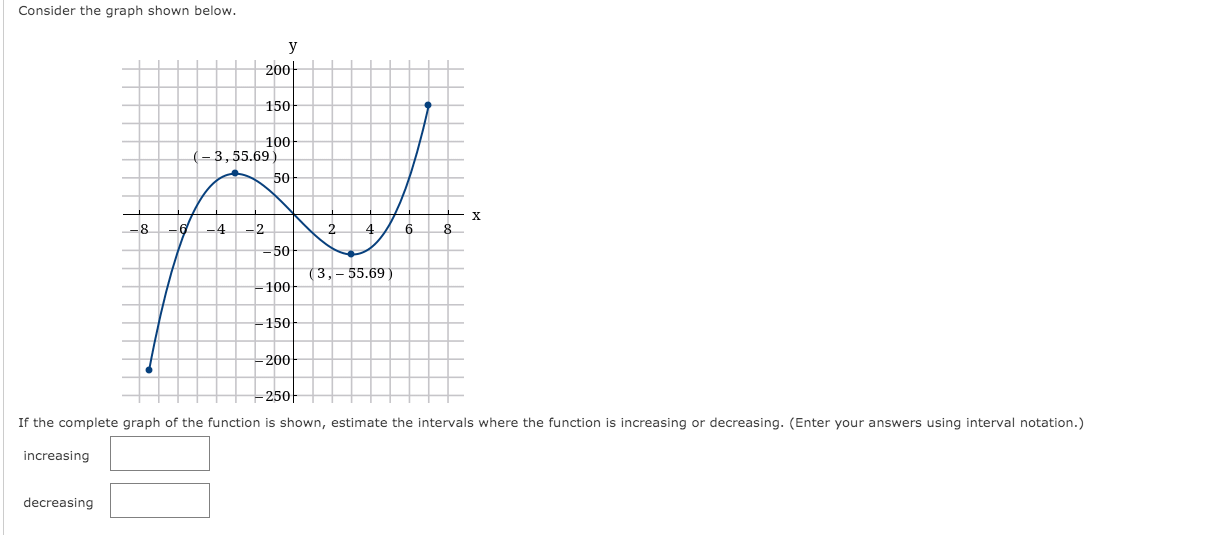
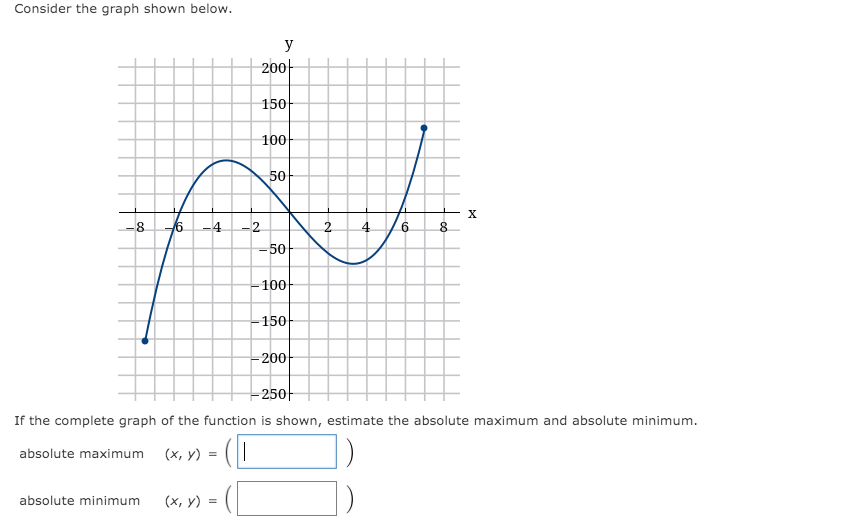
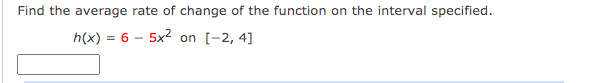
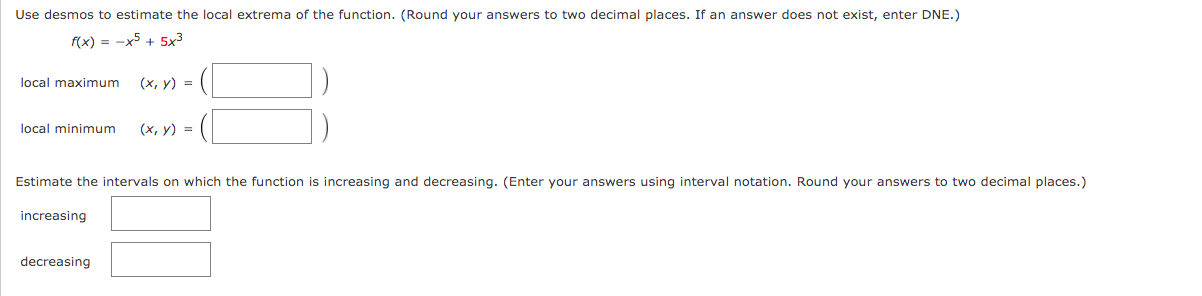
Use the graph of the function to estimate the intervals on which the function is increasing or decreasing. (Enter your answers using interval notation.) increasing X decreasing X X -6-5-4 -3-2-1 2 3/ 4 5 6 -2Consider the graph shown below. Estimate the Intervals where the function is increasing or decreasing. {Enter your answers using interval notation.) decreasing Conslder the graph shown below. Ilmn-II If the complete graph of the function is shown, est Increasing decreasing mate the intervals where the function is increasing or decreasing. (Enter your answers using interval notation.) Consider the graph shown below. 200- 150 100 50 -8 6 -4 -2 X 2 4 6 8 -50 100 150 -200 -250 If the complete graph of the function is shown, estimate the absolute maximum and absolute minimum. absolute maximum (x, y) = absolute minimum ( x, y ) =The table below gives the population of a town (in thousands) from 2000 to 2008. What was the average rate of change of population between 2002 and 2004, and between 2002 and 2006? Year 2000 2001 2002 2003 2004 2005 2006 2007 2008 Population (thousands) 89 84 81 80 76 75 78 82 85 (a) between 2002 and 2004 * people per year .(b).between.2002 and 2006 people per yearFind the average rate of change of the function on the interval specified. h(x) = 6 - 5x
Step by Step Solution
There are 3 Steps involved in it

Get step-by-step solutions from verified subject matter experts