

Question: 4. Using the data for Johnson & Johnson (NYSE: JNJ), presented below: a. Calculate the ratio of each years' data to the previous year for
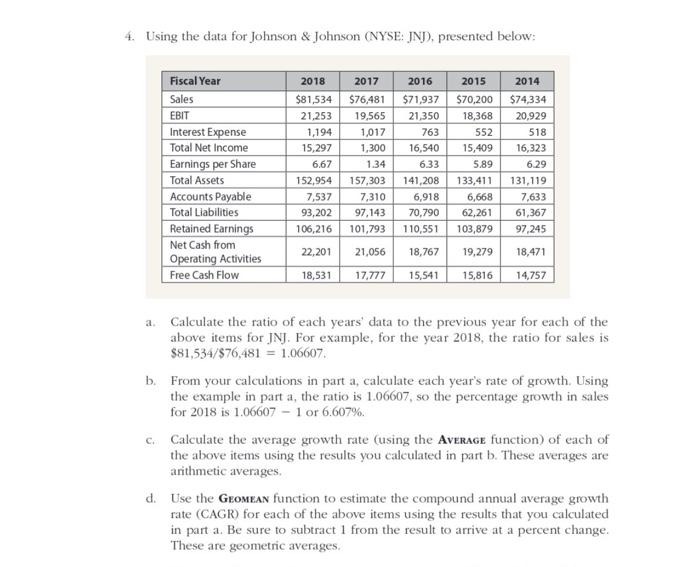
4. Using the data for Johnson \& Johnson (NYSE: JNJ), presented below: a. Calculate the ratio of each years' data to the previous year for each of the above items for JNJ. For example, for the year 2018, the ratio for sales is $81,534/$76,481=1.06607. b. From your calculations in part a, calculate each year's rate of growth. Using the example in part a, the ratio is 1.06607 , so the percentage growth in sales for 2018 is 1.066071 or 6.607%. c. Calculate the average growth rate (using the Average function) of each of the above items using the results you calculated in part b. These averages are arithmetic averages, d. Use the Gromeas function to estimate the compound annual average growth rate (CAGR) for each of the above items using the results that you calculated in part a. Be sure to subtract 1 from the result to arrive at a percent change. These are geometric averages
Step by Step Solution
There are 3 Steps involved in it

Get step-by-step solutions from verified subject matter experts